
Monday, December 31, 2012
Completed Feb high probability option income portfolio
Today, I finally completed my February high probability option portfolio by selling the RUT iron condor as shown below. This month's portfolio is made of all iron condors, because I still consider the market is within an uptrend. The portfolio Vega is about -200. It will gain $200 if VIX drops 1 point or SPX rises slightly over 10 points according to my calculation before (just one way for estimation). To make the portfolio market neutral, I also built a negative delta. In case market drops, the negative delta should help to increase the portfolio value, while the negative Vega causes the portfolio to lose value.
Today's order which was $0.05 below mid-price roughly was filled within 20 minutes (the mid price fluctuated during this time with a bias to the up side). Last Friday, I tried to order a RUT iron condor with slightly different strikes (10 points lower on put spread side). But it was a bit strange that it could not get filled, even if sometimes the mid price was more than $0.20 over what my order asked for. I checked the open interests and volumes of the strikes and saw the OI were over 1000's and volumes were in the range to 100's. But the TOS option sizzle index was 0.65, suggesting a low volume day due to holiday season.
Friday, December 28, 2012
Cut loss on GLD

GLD had behaved badly since my purchase around 12-10. It sold off with hugh volumes after the news that there were progress in resolving the fiscal cliff. Then it rebounced pretty weakly. So I decided to sell this loser and wait for future opportunities to buy it. This time, GLD did not follow the traditional path where UUP would usually falls.
It looks pretty evident, by now, that GLD is heavily influenced by Government policies such as QE & Fiscal cliff resolutions.
Created with ProphetCharts®
Thursday, December 27, 2012
Selling more premiums for Feb high probability portfolio
Market dropped in the last couple of days with higher volumes and the current intermediate uptrend is in danger. With volatility shooting up, I sold more premiums via February RUT and SPX iron condors with about 50 days to expiration.
Since market can drop rapidly and usually rise at a slower pace, I selected short strike prices in the following way: the short put strike had a delta around -20 as analyzed before and the short call strike had a delta around +24. This slight change in my strike selection rule is partially inspired by Karen's interview, and partially intended to reduce the effect of Vega of the high probability portfolio.
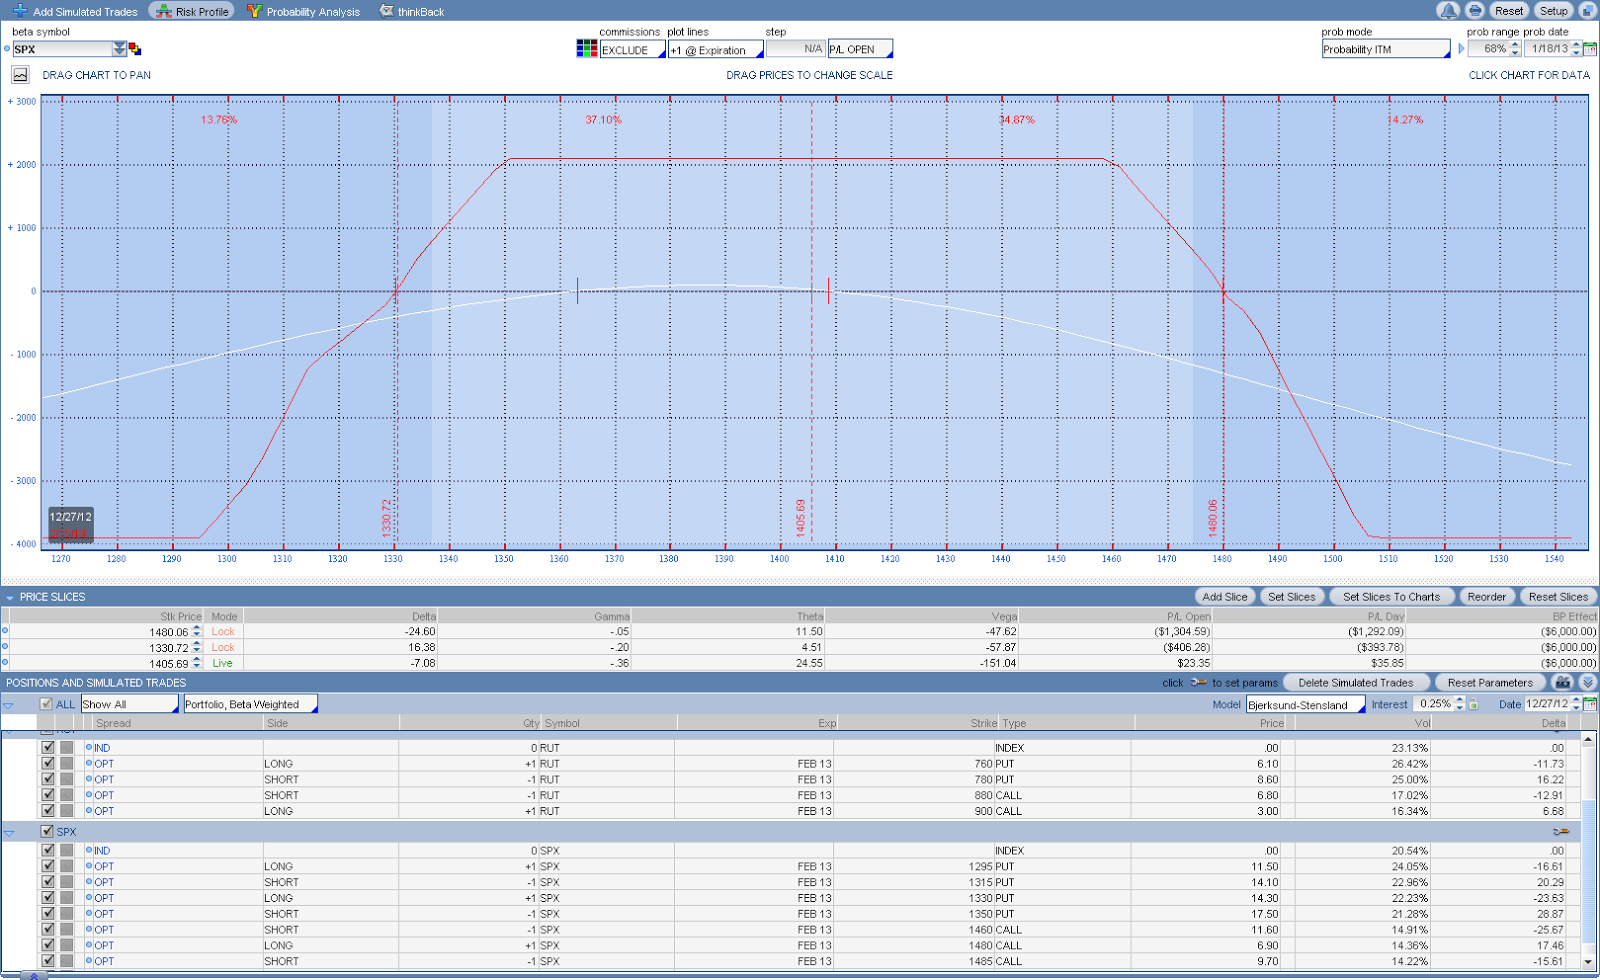
Using the above rule, I sold a RUT iron condor yesterday as shown in the graph below. IC's always have negative Vega, which favors reduction of volatility (market to rise). So the small negative delta of the position can neutralize the effect of Vega somewhat, making the position more market neutral.
 Today, I also sold another SPX iron condor. My current portfolio has a Beta-weighted delta of -7, accommodating some down side market movements. The graph below recorded my current positions on RUT & SPX. I plan to complete my Feb portfolio tomorrow by adding another RUT time-decaying position.
 To calculate how much Delta is needed to offset the Vega to obtain a market neutral portfolio, I used ATR to correlate Delta and Vega of SPX in the following way. Currently, SPX has ATR(30) of 14.3 and VIX has ATR(30) of 1.2. If the weighted SPX Delta x ATR is in the same range of VIX ATR x Vega, then the portfolio is about neutral. Thus, the Vega should be around 10 times of Delta to maintain the neutrality.
As an example, my Feb RUT IC has Vega of -47 and Delta of -5.3 is in the above range, making it perfectly market neutral. My 1st Feb SPX did not opened in this way while the 2nd SPX IC did. In the future, I will follow this rule when I intend to build market neutral portfolio in sideways market.
Since market can drop rapidly and usually rise at a slower pace, I selected short strike prices in the following way: the short put strike had a delta around -20 as analyzed before and the short call strike had a delta around +24. This slight change in my strike selection rule is partially inspired by Karen's interview, and partially intended to reduce the effect of Vega of the high probability portfolio.
Using the above rule, I sold a RUT iron condor yesterday as shown in the graph below. IC's always have negative Vega, which favors reduction of volatility (market to rise). So the small negative delta of the position can neutralize the effect of Vega somewhat, making the position more market neutral.
As an example, my Feb RUT IC has Vega of -47 and Delta of -5.3 is in the above range, making it perfectly market neutral. My 1st Feb SPX did not opened in this way while the 2nd SPX IC did. In the future, I will follow this rule when I intend to build market neutral portfolio in sideways market.
Analyzing short put delta of iron condor vs time decay
A few days back, I analyzed the relationship between OTM put Delta and Theta to understand how time decays for my short iron condors with different short put strikes.
I selected a short RUT put strike of Delta -0.22 in my 20 point wide put spread and another RUT short put strike of Delta -0.25. I kept the call spread within the iron condor the same in this analysis. The former (Delta = -0.22) had a slightly higher Theta (8.28) and Delta (-4.8) as shown in the graph below, while the Vega was similar (actually slightly higher as well) in both cases.
 For the IC with short put of -0.25 Delta, it had a slightly lower Theta (7.95 vs 8.28) and Delta (-3.76 vs -4.8) while Vega remains close (-48.98 vs -49.28). The differently colored curves showed P&L of 6 calendar days apart. So the farther OTM IC would achieve a profit of $265 (vs $259 in closer OTM IC) near Jan expiration time if price does not change.
 Overall, the analysis indicates time decays a little faster for the farther OTM option IC than the closer OTM option IC from 8 weeks to 4 weeks ahead of their expiration. Since I plan to exit positions 4 weeks before expiration whenever possible (as analyzed in a previous post), this farther OTM selection suits my strategy well and it provides higher probability as well. The cost of the change is less credit at the opening( but it does not cause slightly lower profit at the exit as one would expect).
I selected a short RUT put strike of Delta -0.22 in my 20 point wide put spread and another RUT short put strike of Delta -0.25. I kept the call spread within the iron condor the same in this analysis. The former (Delta = -0.22) had a slightly higher Theta (8.28) and Delta (-4.8) as shown in the graph below, while the Vega was similar (actually slightly higher as well) in both cases.
Friday, December 21, 2012
Sell to open SPX FEB Iron Condor and EEM Jan$44 Call
With about 2 month to Feb expiration, I sold an iron condor spread of SPX today as market tanked in monster volume (partly due to quadruple witching expiration of options and futures). My premium sell order for the SPX spread was 10 cents below the mid price as usual. It got filled immediately. The target exit time is 1 month later. The delta of the short strikes were around 23, presenting a high probability (66%) of ITM by Jan expiration time as shown in the graph below. I plan to add to my Feb option inventory every other day later until I complete all my positions of the Feb portfolio.

The volatility $VIX was very high in the last few days and it shot up more than 6% at this morning. Under normal cases, $VIX was supposed to be in the bottom level of its recent two month range, considering SPX was at the top level of its trading range. This type of divergence signaled there were heavy hedging going on against the fiscal cliff and there would be a big move in the market in either direction. So I sold Jan$44c of delta around 0.3 on EEM today to hedge the down side risk a little bit. I have June$40c opened a few weeks ago. So now I converted it into a diagonal spread.

The volatility $VIX was very high in the last few days and it shot up more than 6% at this morning. Under normal cases, $VIX was supposed to be in the bottom level of its recent two month range, considering SPX was at the top level of its trading range. This type of divergence signaled there were heavy hedging going on against the fiscal cliff and there would be a big move in the market in either direction. So I sold Jan$44c of delta around 0.3 on EEM today to hedge the down side risk a little bit. I have June$40c opened a few weeks ago. So now I converted it into a diagonal spread.
Vertical adjustment for January paper portfolio
Yesterday, market was higher and the January paper portfolio intended for monthly income had its delta around -40. The RUT position had its P&L curve very close to the price at the right side. So I decided to remove some delta and pump up the high end by using a vertical spread on RUT. As shown in the graph below, the $25 wide bull put spread produced a delta of 10 and provided a new acceptable P&L curve. The P/L Open field should add $550 to account for adjusted positions for this month's portfolio.

Thursday, December 20, 2012
Closed December RUT butterfly
Yesterday, I finally closed the RUT butterfly to exit all December positions with 2 days left for expiration. In the last week of the butterfly, I observed it to receive a 15% of max potential profit while RUT price was very close to the short strike of $835. It did not reach my target of 20% though. After a couple days of wiggling by the RUT, I had to sell this spread for a minor loss. The sell order which was 5 cents below mid price was executed immediately.
This trade reinforced my understanding of butterfly spreads. A normal butterfly would start to gain value in the last 7 days if market moves in the desired direction. A unbalanced butterfly would start to gain in about 2 weeks to expiration.
Unbalanced Butterfly spreads are good adjustment vehicles in bull market only if the portfolio expiration date is close to 2 to 3 weeks and one intend to hold the option positions close (10 to 5 days) to expiration. If there are more than 3 weeks, unbalanced butterfly spreads may not be good adjustment strategy, depending on its Delta and Theta mainly. If the adjustment trade brings little delta and theta, it's usually a bad adjustment since it does not impact the portfolio much at the adjustment time. For this reason, a normal butterfly is not good adjustment for the smooth option portfolio that I trade. In non-bull market, the unbalanced butterfly may not be good adjustment strategy due to its negative Vega.
Friday, December 14, 2012
Less expensive adjustment vehicles for Delta neutral portfolios
In this month (December) adjustments, I had to use SPY to adjust my delta without impacting Theta and Vega. Buying 200 shares of SPY would cost about $28,000 at current market level. It requires a lot of buying power. So I played with the double long ETF for SPY: SSO and triple long ETF: UPRO in the TOS analyzer, in order to reduce the buying power impact during adjustments. I found SSO (~$60) appeared to be a nice replacement vehicle for the adjustments. It costs less than half of the SPY and can produce a SPX delta of 8.4 for 100 shares. So overall, the buying power requirement can be reduced by about a half using SSO. For some reason, the triple long UPRO could not be used in TOS analyzer as it does not show any delta value.
If negative delta adjustment is needed, I would expect the SPY double short ETF SDS would work similarly. It's around $55 at present. I plan to use these two ETF's as adjustment vehicles in the future.
If negative delta adjustment is needed, I would expect the SPY double short ETF SDS would work similarly. It's around $55 at present. I plan to use these two ETF's as adjustment vehicles in the future.
Wednesday, December 12, 2012
Bullish position trades on GLD and IWM
I had been quite busy with my portfolio adjustments and new bullish position trades, as well as the blog in the last couple of days. So I decided to record the bullish position trades after blogging about the monthly income option portfolio to spread my limited time each day.
On Monday, I saw GLD and a couple of other ETF's meeting my bullish entry rules. Usually, I'd like to get into positions one by one. So I bought the GLD Jan14$157c LEAPS. I do intend to hold this one longer than other position trades as mentioned before, but I'm not sure if I have enough time to manage it later. So I may exit it along with other position trades if I have too many positions in my multiple portfolios.

On Tuesday (yesterday), I bought IWM June$80/Jan$86c diagonal for a position trade. I shorted the Jan$86c because IWM seemed to be risen quite a bit already. I may get rid of the short call later in a pullback.
 For all of my position trades, I do plan to sell option premiums later when the stock rises extensively. I'll describe what I consider extensive later when I start to sell front month calls.
Additionally, I also increased my position size of IYR by 50% using a new bull call diagonal on Monday.
On Monday, I saw GLD and a couple of other ETF's meeting my bullish entry rules. Usually, I'd like to get into positions one by one. So I bought the GLD Jan14$157c LEAPS. I do intend to hold this one longer than other position trades as mentioned before, but I'm not sure if I have enough time to manage it later. So I may exit it along with other position trades if I have too many positions in my multiple portfolios.
On Tuesday (yesterday), I bought IWM June$80/Jan$86c diagonal for a position trade. I shorted the Jan$86c because IWM seemed to be risen quite a bit already. I may get rid of the short call later in a pullback.
Additionally, I also increased my position size of IYR by 50% using a new bull call diagonal on Monday.
Tuesday, December 11, 2012
Rolled up SPX Iron Condor in high probability paper portfolio
Yesterday, my paper portfolio testing 2 month high probability, market neutral strategies showed a delta of -39 and prices went to the right slope of P&L chart. So I reviewed the positions and found the SPX Iron condors required adjustment.
 My adjustment goal was reducing Delta while maintaining similar profit if possible. To buy back the $11.40 IC and sell the new $10.05 IC, I had a deficit of $1.35. Thus, I also rolled up the $1.05 put spread (debit) to a new $3.05 put spread (credit). In this way, the overall SPX roll gave the portfolio an extra credit of $0.65 which offsets the transaction costs and commissions.
 After the adjustment, the P& L Chart looks like below. It still has a delta of -27, a bit higher due to the RUT positions.

December Income Option Inventory Closing Down
Yesterday, RUT was marching higher and caused my portfolio delta moving further than -40. With Gamma over 2.5, I decided to exit the monthly income positions to take what ever market gave me at the moment and avoid additional risks. I forgot to take a snapshot before closing down positions and realized that after a few trades. So the chart below does not have the correct P&L figures but it records the Greeks for my future analysis.
 Eventually, I closed all positions except a RUT butterfly shown below. The profit target is 20 to 30% of MAX. I may close it if the probability changes from 20% to 10% or so.

Sunday, December 9, 2012
How portfolio Greek changes within last 2 weeks of expiration
After a series of adjustments to my December high probability option trade portfolio, its P&L chart does not look really smooth anymore. The red expiration curve shows more profits if price goes higher by 10 or more SPX points while the portfolio delta is -26 which indicates more profits if price goes lower. So I studied its Greeks verse time and prices using the ThinkOrSwim Analyzer.
First, let's take a look at how Delta changes as days get closer to expiration and prices fluctuates . After analyzing the delta changes in time, I found my delta would continue to go more negative in the next few days and it would start to increase only in the last 7 days to expiration as shown in the image below. The daily delta changes would be smaller if price increases to 1423 vicinity. I think it is most likely caused by the butterfly spreads that the portfolio has.
 Secondly, let's review the daily changes of portfolio Theta. It's likely to change $10 to $20 each day next week at the current price range. However, if price goes a little over $10 which correlates to the top spot of the portfolio P&L curve, the Theta decay will be maximal for this portfolio. Theta decay will be smaller outside the indicated range in the following image.
 Thirdly, the portfolio Vega is small (16) right now and it will double or triple in the next week even if price does not change. This is because the volatility will make up most of the time value in the last few days of expiration while Theta diminishes. The Vega will also shot up if price drop by 15 points.
 Forth and lastly, let's see how profit and loss changes in the next 2 weeks. The following P&L chart shows profit will double 8 days later if price remain the same. If SPX price drops a bit, the profit will also increase. I believe the profit curve will have its top shifting to the 1430 area in the last 4 to 1 days of expiration to match the original expiration curve.
 There are probably a number of conclusions that can be drawn from this type of Greek analysis and be incorporated in option trading rules. At the moment, I'm particularly interested in the daily Theta decay and Vega enrichment in the last 2 weeks before expiration. These two components are the time value of OTM options. For a market neutral portfolio comprising of many iron condors, the decrease of time values in the last 2 weeks will not be as dramatic as one would typically expect as long as the short strikes are still out-of-money. It's an evidence supporting early IC exit (about 2+ weeks before expiration). There is probably no significant loss of time decay if one starts IC 2 month ahead. Further study will be done to check it out.
First, let's take a look at how Delta changes as days get closer to expiration and prices fluctuates . After analyzing the delta changes in time, I found my delta would continue to go more negative in the next few days and it would start to increase only in the last 7 days to expiration as shown in the image below. The daily delta changes would be smaller if price increases to 1423 vicinity. I think it is most likely caused by the butterfly spreads that the portfolio has.
Saturday, December 8, 2012
Bullish position trade on EEM
Since market upturn over a week ago at the end of last month, I have been watching a few ETF's for potential bullish entry. But my MFI indicator for these ETF's were holding me back. Starting from last Thursday, I could see MFI of some ETF's approaching 50 or higher. So, I bought June$40c of EEM as its MFI is about 50 on Thursday. It's intended to be a position trade for the duration of the current market rise.
 I think this wave of uprising is powered by China's ETFs. The HAO has been performing strongly even before the market upturn confirmation day as shown in the performance comparison chart during the market correction period around 70 days. I'll use it as the leading indicator for this wave. If it gets in trouble at rising, I'll consider it as a warning sign to the current market bullishness.

Thursday, December 6, 2012
Continuing delta adjustments for the option premium selling portfolio
Today in my morning time, the market was slightly higher. It looks to me the market is showing another sign of bullishness, as it refuses to make a significant drop after the recent big run-up. My portfolio still has a delta over -26. This portfolio risk is in acceptable range if SPX shot up 20 more points. But since the time is getting close to my exit days, I decided to trim down my inventories to further neutralize my portfolio delta. So I closed a RUT double calendar as shown in the image below for a $150 profit to increase the delta to -14. It also took a $10 theta away from my profit potential and over 100 vega at the moment. The P/L in the chart should be reduced by around $700 ($850-$150) to account for the closed calendar position yesterday shown in the last blog.

Bought SPY to increase delta of option premium selling portfolio
Yesterday, my December option premium selling portfolio delta reached close to -60, a level that I have not experienced before. Although I was not terribly uncomfortable with the value, this market typically don't skyrocket high rapidly and there are about 15 days to expiration, I still felt I had to do some risk management to my portfolio to avoid the unlikely but possible damaging event. So I bought 200 shares of SPY to reduce my delta by 200. I also got rid of a hedging calendar of RUT $740c to reduce the delta by another 10. This resulted a total reduction of delta by 30 approximately and a theta increase by a few dollars since the RUT calendar had negative theta.
 I also found EEM had a breakout after Chinese market and ETF jumped. The EEM met my bullish position trading rules so I bought June$40.5c in this account which helped the delta by 1 or 2 points while reducing theta a little. I plan to hold the position trade until my rules telling me the uptrend is about to end.
Tuesday, December 4, 2012
Another adjustment with butterfly to pump up profit curve
As market turned up at the intermediate term, my option premium selling portfolio for December has been dealing with rising delta. Yesterday as time was gradually get closer to expiration, I found it's helpful to create a regular butterfly spread which increased theta and reduced delta for the smooth portfolio. The main effect appeared to be pumping up the right slope of the P&L chart from 1430 to 1440 area as shown in the image below. When the 2 to 3 day pullback is done, I might have to purchase 100 or 200 SPY to neutralize portfolio delta by 10 to 20 points, weighted on the SPX index. It should keep my theta around 100 for a few more days so that I can close the December portfolio about 2 weeks before expiration.

Saturday, December 1, 2012
Responded to Bull Attack at the High Probability Portfolio with Butterfly
On last Thursday, the 2 month out paper portfolio experienced a bull attack on the up side when the bulls reached the east boundary of the portfolio break-even points. The weaker RUT position suffered a small temporary blow as shown in the P&L chart below. Note the delta reached -52 with about 8 weeks to expiration. If the portfolio were built with shorter term options, it would cause lot more damages.
 In response, I brought up a small, additional reserve capital to help fight the bulls by moving my eastern frontier further out, through a launch of a 2 month butterfly. The butterfly provides some longer term protection to my expiration territory and has little values of Greeks for the near term. The new battle map below indicates an approximate 10 point advance by my soldiers to the east boundary, with limited changes to the Greek values.
 The portfolio is definitely stressed at the moment, as indicated by the Greeks. But my soldiers are still in good formation and they have plentiful of time waiting for the probabilistic market to assert himself. Of course, the portfolio is given a risk tolerance of $1,500 should SPX shots up $30 more points relentlessly to 1445 level, since high probability does not provide any guarantee for this specific trade. This is understood as the mind set of successful traders.
Note: There was cancellation trade for RUT Jan$830c. It resulted margin increase of $2000 and the new profit in the chart should be reduced by $870. I was busy testing different strikes and forgot to verify the existing strikes after I chose the final butterfly strikes.
Note: There was cancellation trade for RUT Jan$830c. It resulted margin increase of $2000 and the new profit in the chart should be reduced by $870. I was busy testing different strikes and forgot to verify the existing strikes after I chose the final butterfly strikes.
Friday, November 30, 2012
Adjusted high probability portfolio with butterfly
Yesterday, RUT rose significantly and my RUT position reached the adjustment point due to both price increase and volatility drop.


Tuesday, November 27, 2012
RUT Calendar adjustments to high probability portfolio
RUT has been rising for the last 7 days. Though it may be near the end of this rally, the RUT position P&L curve showed the price entered its right sloping side. It's also reflected on the overall portfolio chart as shown below.
 I did play with possible vertical adjustment for the RUT and could not find good trades that can keep the chart smooth. So I used calendars to extend the high break-even point of RUT by about 10 points higher. However, it did not add much distance to the right side of the overall portfolio chart as shown below. After the adjustment, the potential profit at the right side of the chart has good amount of increase while the potential loss at the right side also increased modestly. There was not much Delta neutralization in this adjustment.

Tuesday, November 20, 2012
Completed Jan High Probability Paper Portfolio
After setting up a position every other trading day in the last week or so, I finally completed the 2-month out paper trading portfolio today with a double calendar as usual. This is the 2nd option cycle for this test. I played Jan/Feb vs Jan/Mar DC's of identical strikes shown in the image below, and found the Jan/Mar DC provided about 1.9 to 2 times of the values of Greeks and cost, when compared with those of Jan/Feb DC. The main reasons I chose Jan/Mar DC are flatter P&L top and higher theta (9 vs 4.8). Note the margin requirement is $8,000 at the analyzer, while it was $6,000 for last option cycle which had similar positions.
 In the two month out portfolio, the probability of expiring beyond break-even points in Jan is around 6 to 20% at the moment, even if the short options usually have delta around 0.25. This portfolio has a significantly higher probability than the front month portfolio for a trading period of 30 days approximately.
In the last cycle for December options, the portfolio ended with a small gain. But it's more encouraging in that it had reached current target of 10% profit before dropping to final closing value. This 2-M portfolio also is characterized with low maintenance efforts due to its wider profit zone.

In the last cycle for December options, the portfolio ended with a small gain. But it's more encouraging in that it had reached current target of 10% profit before dropping to final closing value. This 2-M portfolio also is characterized with low maintenance efforts due to its wider profit zone.
Saturday, November 17, 2012
November Trade Review
As part of my trading process, it's time for my monthly trading review for November, based on my template for the review.
Trading Rules
- Adherence consistency
- Skillful application/execution
- Monthly rule review/study
Psychology
- Action during uncertainty
- Risk Comfort ability/Adverse damage impact
- Trade anxiety
- Winning Altitude Development
Trading Time
- Trading days
- Rest days
Trades and Market Replay
- Market Forecast
- Trades and Adjustments

Thursday, November 15, 2012
Adjusting portfolio with calendars
Market continued to drop in the last couple of days. The portfolio reached a delta of 22 with price shifting to the middle left side slop of the P&L curve. If SPX dropped 1o (78 points), the portfolio loss would be around $3000 as indicated by the analyzer.
 So, it's time for an adjustment. The suffering side is the RUT double calendar. The Dec/Jan$740p calendar would be normal adjustment for RUT. But there is already a Dec$740p long position in the portfolio. So I used the Dec/Jan$740c instead. The call calendar costs (<$1.00) less, has a little higher delta and provides less ($2) Theta as well. Vega of the two calendars appear to be similar.

Wednesday, November 14, 2012
Rolling down IYR diagonal

IYR broke major up trend support and 200 dma. I rolled half to Dec$63c yesterday for a credit of $0.86 and another half to Dec$62c today for credit of $0.85.
On 11-2, I had to roll up to Dec$65c for a debit of $0.88 and Dec$66c for a debit of $1.33, due to short delta rising above 0.7.
Since IRY had been going down straight for many days, I'll wait to see if a rebounce is weak enough to headge the long term bullish position.
Created with ProphetCharts®
Tuesday, November 13, 2012
Completed Dec High Probability Option Portfolio
Encouraged by the performance of the early-starting high probability portfolio and strategies, I completed December's inventory with 37 days to expiration. The idea is to gradually move to establish the positions earlier so that the portfolio has wider break even points.

Monday, November 12, 2012
Fixing an error in trade order for smooth portfolio
I started to build up my December option inventory in the last couple of trading days. But I made an trade order error when placing an order for SPX IRON Condor: my new long strike of Dec$1445c happened to cancel my existing short strike Dec$1445c. I noticed it after the order was filled and the P&L dropped a couple of hundred dollars in the analyzer. The margin requirement also increased $2000 more than what's normal. So I did two more verticals to get the margin back to normal and formed two IC for the SPX position. This error will probably cost the portfolio around $100, considering the transaction cost, commissions and market price drifts.
 I know it would be an error. But I forgot to examine existing positions today. To reduce this type of errors in the future, I'll add a specific trading rule: when creating new orders, I must review existing position and make sure there will be no deletion of existing positions. It must be part of my order review process.
Sunday, November 11, 2012
The Successful Mind Set of High Probability Traders
As part of my trading process review, I studied the trading psychology in the last couple of weeks and plan to go through two major psychological areas in a couple of my posts.
Today, I'll go through the first topic about the mind set and winning altitude. High probability means a good chance of success over a large amount of events statistically, but it does not guarantee success for any specific and single event during the process. So successful traders must have the following carefree state of mind to accept the uncertainty of each individual trade.
To achieve success consistently in high probability trading, we must integrate the following actions with our trading process.
- The successful state of mind of high probability traders
- The integration of the successful mind set with the high probability trading rules
Today, I'll go through the first topic about the mind set and winning altitude. High probability means a good chance of success over a large amount of events statistically, but it does not guarantee success for any specific and single event during the process. So successful traders must have the following carefree state of mind to accept the uncertainty of each individual trade.
- Any outcome is possible after a specific trading action is taken.
- Market can give us a win or a loss at each time randomly.
- Market is unique every day without any exact association with its past.
- The high probability rules provide a higher probability only and guarantee overall successes statistically.
- There is no need to know market's next move to make profits. We must know what we will do next, based on any possible market moves.
To achieve success consistently in high probability trading, we must integrate the following actions with our trading process.
- Pre-define risks of every trades
- Completely accept the risk or take action to eliminate non-tolerant risk
- Objectively identify trading opportunities
- Execute trading rules for each opportunity without reservation and hesitation
- Reward ourselves as market gives a win for us
- Keep monitor trading processes and susceptibility for making errors
Wednesday, November 7, 2012
Rolling down of Dec SPX Iron Condor
Market sold off hard after the election day. In the paper-traded 2 month out portfolio, the SPX positions showed a need for adjustment. Specifically, market price has fallen into the left slope of an iron condor curve. So I rolled the IC down about 20 points. I still got an extra credit of $0.65, due to the higher volatility and plenty of time to expiration. The new SPX P&L curve is shifted left side about 20 points now. Note the portfolio had a 10% profit of $600+ yesterday before the sell-off.

Tuesday, November 6, 2012
Closure of November Option Inventory
With 9 days left for the expiration, I closed all remaining November positions to avoid any surprises after the election. The VIX increased yesterday while SPX rose ahead of the election. On the election day, VIX dropped about half a point at mid day time, causing my Vega positive portfolio to lose some value. Since the remaining positions were mostly calendars, the portfolio Vega was the major contributor for the small market moves. It was a little bit strange that all of my SPX closing orders that were $0.10 above mid-price got filled instantly.
 Yesterday, I trimmed down my inventory to reduce risks. Closure of IC neutralized the delta and closure of the double calendar reduced the Vega as shown in the images below.

 On the paper-traded 2 month portfolio, it has been very smooth up to now. I plan to close it around this Friday. It's very encouraging time-frame that requires my further study soon.
Sunday, November 4, 2012
A Glimpse of option strategies of Karen, the super trader who made over 100M profits
I watched the Tasty-trade interview video for Karen, the super-trader today. It was so inspirational and I have to note down the highlights for future study. Here's the list of the key points that I have captured at the moment.
Trading Vehicle: options for SPX, RUT, NDX
Strategy:
 Option strike selection
Option cycle selection
Entry (Legged in)
Exit (It was not really clear to me at this point)
Adjustments: Use additional capital to keep profits and TOS analyzer tool
Money Management
Psychology and Mindset
Trading Time: Monitor markets during all trading days and hours
Trading Team: 5 traders of similar mind and 1 accountant
Trading Vehicle: options for SPX, RUT, NDX
Strategy:
- short puts and calls, combination short strangles.
- Better profits than Iron Condors but has unlimited risk in theory.
- Calls: 90% probability of success (10% ITM prob.) and above major resistance level
- Puts: 95% probability of success (5% ITM prob.), corresponds to about up to 12% SPX drop
- Usually sell more put contracts than call contracts
- Around 2 standard deviation Bollinger bands
Option cycle selection
- Start with 56 days (8 weeks) before expiration to get wider profit zone and open with 50%+ positions
- Also may adjust with options of same cycle as the starting position for average market conditions
Entry (Legged in)
- Sell calls when market rises
- Sell puts when market falls
Exit (It was not really clear to me at this point)
- Usually exit in a month
- Profit target is around 15% of positions
- Will let further OTM (1% ITM probability) options expire worthless
Adjustments: Use additional capital to keep profits and TOS analyzer tool
- Start adjustments when ITM probability reaches a certain number, like 30%.
- Normally, keep identical profits by rolling up/down/out and selling new contracts.
- Under extreme market sell-off conditions (1000 point drop in DOW JONES average), give up profits of a few month to roll out a couple of months and wait for market to settle down.
- No stop losses, No delta neutralization via call/put purchases.
Money Management
- Suggested usage of 50% of capital
- With adjustments on, use up to 70/80%
- Large use of capital justified by wide break-even points
- Watch net liquidation values (I'm not clear about it)
Psychology and Mindset
- Trading is a number's game
- Focus on the probability, not P&L.
- Manage trading process
- Losses are acceptable (No fear)
- Lower returns caused by lower market volatility are OK
- Keep rules simple and anything else are noises
Trading Time: Monitor markets during all trading days and hours
Trading Team: 5 traders of similar mind and 1 accountant
Thursday, November 1, 2012
Closing down high probability portfolio option inventory
Market jumped up today, making the portfolio delta switching from around -15 to +17 with gamma around 1.7. With 14 days to expiration, it's about time to close down the inventory now. The big delta change was mainly caused by the RUT vertical spread hedged last week.

So I closed the vertical and the iron condor of the RUT, leaving a double calendar alive which is pretty much at the center of the strike prices. The SPX P&L curve is still looking normal with delta around 2. After the adjustments, the SPX-weighted portfolio delta is around 3 with a theta over $100.
 I plan to close all November options in the next few trading days.
So I closed the vertical and the iron condor of the RUT, leaving a double calendar alive which is pretty much at the center of the strike prices. The SPX P&L curve is still looking normal with delta around 2. After the adjustments, the SPX-weighted portfolio delta is around 3 with a theta over $100.
Sunday, October 28, 2012
October Trading Review
It's a busy weekend so I have to limit my writing here this time. I may update this review later when I have more time. Based on my template for the review, here're my topics.
Trading Rules
Market has told me the weak spot in my trading rules in September: Need to reserve extra time for trade adjustments. Currently, my system holds options till last 1 or 2 weeks before expiration. This is a fast time decay period but also risky due to lack of additional time in case trade adjustment is needed. In the past year, statistics kicked in most of times to favor fat profits in the last period of the cycle. However, there was only one time of September in which market would take away all those profits earned in the last period and it's a normal behavior for market statistics. If I had one or two more weeks for the options in September, the profits would have been kept safely. So I'll update my trading rules to make sure there is enough time to allow trade adjustment working in the last period of my monthly option cycle.
Psychology
I'll set up my rules so that I can take whatever P&L the market offers to reduce risks, instead of a fixed % of profit target. Winning consistency is a state of mind that excellent traders think in a way similar to below. The market offers endless opportunities month after month for theta seekers. Why worry about a couple of months that may not have profit. The high probably trades are guaranteed by statistics. The losses should be expected, the money management and adjustment rules guarantee limited damages. Trade to another month since there are always endless months to continue for profits. Even an average of 3% per month is an excellent achievement for a trader.
Trading Time
Trades and Market Replay
October high probability portfolio was a short and sweet cycle with just one adjustment to hedge the downside risk. Even though it turned out the market did not sell-off after the hedge immediately, the smooth portfolio still reached its target around 3 weeks after initial position.
Trading Rules
- Adherence consistency
- Skillful application/execution
- Monthly rule review/study
Market has told me the weak spot in my trading rules in September: Need to reserve extra time for trade adjustments. Currently, my system holds options till last 1 or 2 weeks before expiration. This is a fast time decay period but also risky due to lack of additional time in case trade adjustment is needed. In the past year, statistics kicked in most of times to favor fat profits in the last period of the cycle. However, there was only one time of September in which market would take away all those profits earned in the last period and it's a normal behavior for market statistics. If I had one or two more weeks for the options in September, the profits would have been kept safely. So I'll update my trading rules to make sure there is enough time to allow trade adjustment working in the last period of my monthly option cycle.
Psychology
- Action during uncertainty
- Risk Comfort ability/Adverse damage impact
- Trade anxiety
- Winning Altitude Development
I'll set up my rules so that I can take whatever P&L the market offers to reduce risks, instead of a fixed % of profit target. Winning consistency is a state of mind that excellent traders think in a way similar to below. The market offers endless opportunities month after month for theta seekers. Why worry about a couple of months that may not have profit. The high probably trades are guaranteed by statistics. The losses should be expected, the money management and adjustment rules guarantee limited damages. Trade to another month since there are always endless months to continue for profits. Even an average of 3% per month is an excellent achievement for a trader.
Trading Time
- Trading days
- Rest days
Trades and Market Replay
- Market Forecast
- Trades and Adjustments
October high probability portfolio was a short and sweet cycle with just one adjustment to hedge the downside risk. Even though it turned out the market did not sell-off after the hedge immediately, the smooth portfolio still reached its target around 3 weeks after initial position.
Friday, October 26, 2012
Vertical Adjustment for the high probability portfolio
Market does not want to offer an exit for the November high probability trade portfolio this week and continued to drop. Even though the SPX and VIX are at the borders of their corresponding Bollinger bands, there is no sign a capitulation. I'm concerned that continued market sell-off would cause my delta even worse. So I played with calendar adjustment first and realized that an ATM vertical spread served the best for the smooth portfolio. So I sold a $15 wide RUT call spread to neutralized delta by 17. The adjusted portfolio P&L curve looks like the following.

As a record, the P&L curve before adjustment is shown below.
 On the IYR front, I have rolled the Nov$65c down to Nov$63c a couple of times, one half yesterday for a credit of $0.84 and one half today for $0.75. The support appears to be at $62 area by 200DMA line.
As a record, the P&L curve before adjustment is shown below.
Tuesday, October 23, 2012
Triple Calendar Adjustment for Delta Neutral Portfolio
Market had a sell-off early in the morning, then rebound a little bit. Since SPX broke my support line around 1420 with higher volume and the SPX P&L curve was attacked from the low end, I decided to hedge my portfolio with adjustments.

After playing with a few strategies trying to neutralize delta, I settled on a triple calendar that reduced delta by 4. It is not an easy job to make large delta adjustments while maintaining a smooth P&L curve and it's not necessary to cut delta to 0 in one shot. I placed 3 separate calendar orders with $0.10 above mid prices. They all got filled in a few minutes.

 Note on the paper traded account for 2 month expiration option portfolio, there was no need for adjustments, as the delta and the graph did not show any needs.
After playing with a few strategies trying to neutralize delta, I settled on a triple calendar that reduced delta by 4. It is not an easy job to make large delta adjustments while maintaining a smooth P&L curve and it's not necessary to cut delta to 0 in one shot. I placed 3 separate calendar orders with $0.10 above mid prices. They all got filled in a few minutes.
The following image was simulated to record the P&L graph before adjustment and showed movement of break even points.
Subscribe to:
Posts (Atom)