Pages

Showing posts with label SPX. Show all posts

Sunday, May 21, 2017

Simple Hedging Strategies for Market under Pressure

On Wednesday of last week, we saw market stumbled with huge volume due to fears about possible presidential impeachment. It created technical damages to the SPX chart as shown below, even after a subsequent 2 day rally.
  1. SPX price went back to $2400 ~ $2330 range
  2. SPX 50 day moving average seemed to move sideways
  3. 4 distribution days accounted in the last few weeks
  4. Momentum indicator MACD turned
  5. Cyclical indicator Stochastics turned below 80

If SPX falls below 2352 in the next few days and register more distribution days, it would require more hedging actions. The simple strategy to use is to sell and/or roll down short call options and minimize weak positions to reduce portfolio risks. Since I have short calls already sold last Wed., I’ll roll down some of the call options in such an event.

In the meantime, if the accumulative new highs – new lows index of NASDAQ & NYSE also shows a top, I would consider the market outlook as going to correction for a couple of months at least. I would continue to reduce positions, as I had already sold the weakest performer (PVH) in my portfolio.

In general, the accumulative new highs – new lows indicators of stock market on NASDAQ and NYSE exchange are effective indicators to signal intermediate and long term market tops.  They usually do not turn down in short term pullbacks.  Therefore, they can be used as a type of filter to market fluctuation noises in the short or near terms to help intermediate and long term traders to maintain bullish positions. If there is at least one of these indicators (on ether NASDAQ or NYSE) trending up, then the market is likely not to go to a correction phase yet. However, this type of indicators may lag other indicators where rapid sell-off occurs during market tops, particularly in climax selloffs.

There is also a possibility that the market will continue to rise. I’ll be convinced of the resumption of the market up-trend if SPX tries to fall then recover to show a bullish candlestick pattern along with improving indicators in the SPX chart. If market grinds higher, I may roll up my short call option strikes to allow me to gain mild profits.

Sunday, May 7, 2017

Recent History of Election's Impacts on the US Stock Market

As traders, we are interested in the short term impacts on the stock market by major elections. Will tomorrow's French presidential election impact the US stock market again? Based on my study below, the Wall Street is telling us: No, as the VIX is at very low level, which is quite different from that on the day before the initial French election result about 3 weeks ago.

As part of the study on major election impacts on the US stock market, I looked at the prices of both SPX and VIX in the past year as shown in the chart below.
SPX & VIX's Reactions to Major Elections

  • More than 50% of time when VIX reached 16.5 and above were due to pending elections
    • British EU Exit (Brexit)
    • US Presidential Election
    • French Presidential Election (Initial)
  • VIX created negative divergences when foreign elections were pending
    • SPX price does not fall deeper but the fear on the stock market (VIX) increases to higher level
      • The negative divergence suggests over-abundance of fear
      • It's usually bullish for stock market

These are my observations only. What are your findings as a seasoned trader?  For the long history of how stock market reacts to US presidential elections, I found the following article very helpful: How the stock market performs on, and after, Election Day on MarketWatch.com.

Since traders need to prepare for major events before they occur, we are interested in FED announcements as well. I had studied the impacts of FED announcement on stock market before in my post: A Study of Market Moves, VIX and FED meetings. I plan to update and review the recent impacts of FED announcements in the future when I get a chance.

Sunday, May 4, 2014

Continued analysis of Karen style short put trades during flash crash

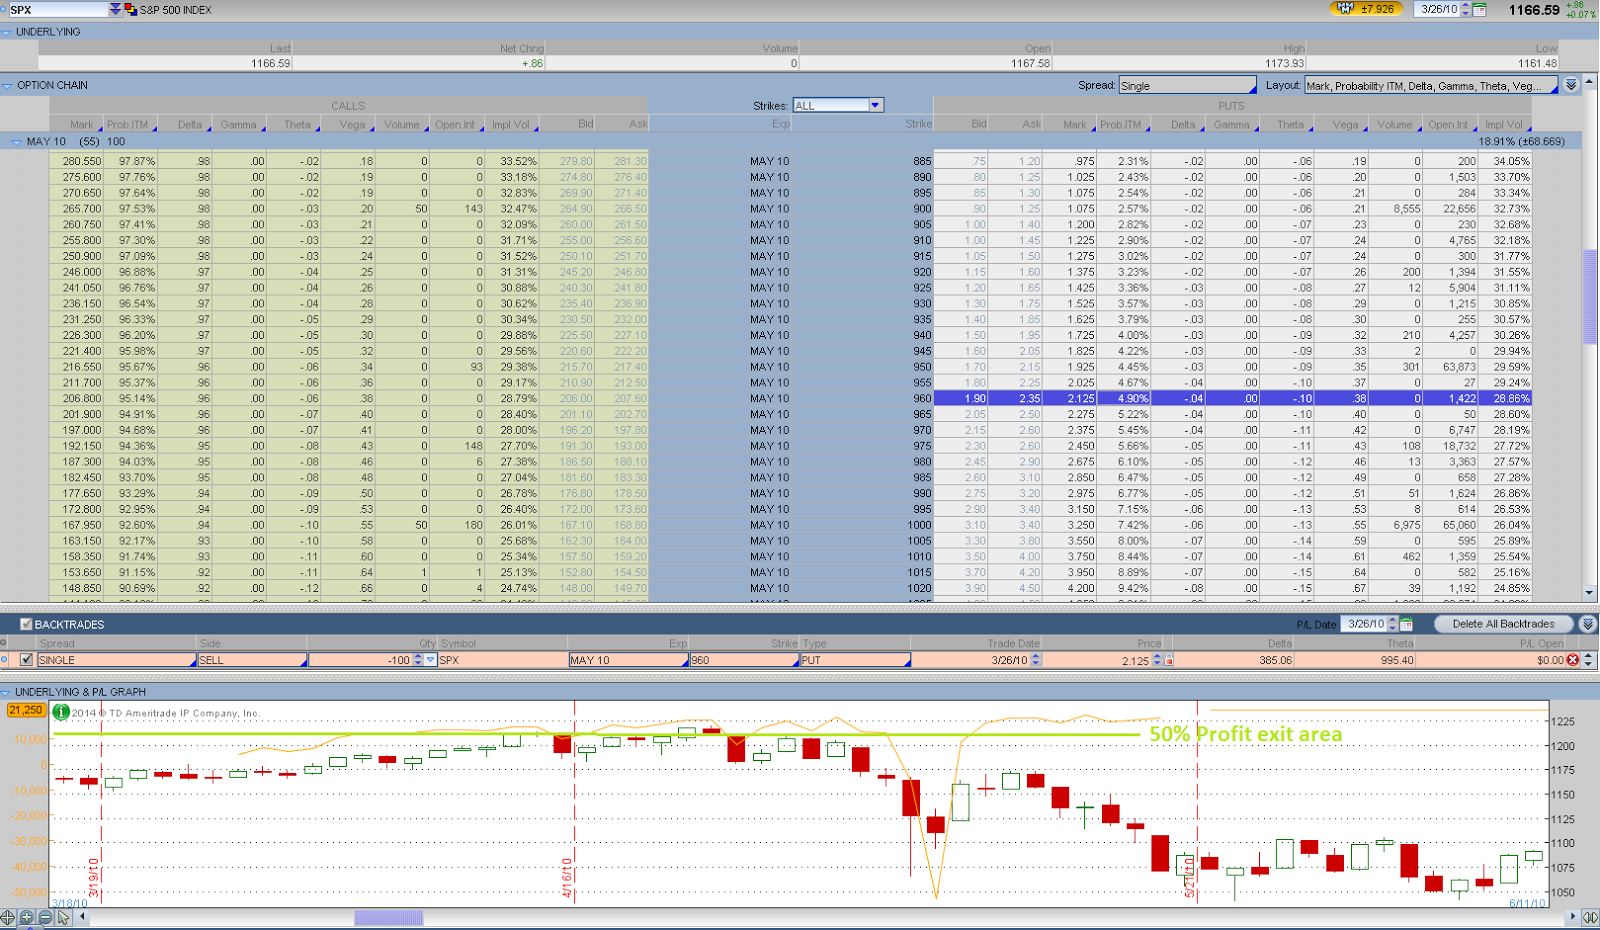
After the last post on flash crash study, I tried to create a couple of simulated trades for the flash crash option cycle using Super trader Karen's style and to test possible adjustments on the big down days (May 6 & 7 of 2010). The results were a bit surprising as the simulated positions did not pass the 30% ITM probability too much according to end-of-day data from TOS. The following is the details of my analysis of the simulated trades.

Karen discussed the flash crash day as a great day of option trading for her style. She mentioned she had to give up profits for a few months to get into a safe territory. Before the crash date, a portfolio of Karen style would have naked options of the May (14 DTE) and June (42 DTE) cycles most likely. The May options might be started more than 40 days ago in the last two weeks of March following the 56 day rule to open trades. The June options might be started over 14 days ago in the last 2 weeks of April. 

Let’s take a look at the life of the May put options first. As marked in the above chart, March 25 was the 56 DTE. On the next market down day on March 26, we could sell SPX May $960 put which had ITM probability of 4.90% for $2.13. However it was a bit surprising that the actual trading volume for the strike was minimal. It looked like Karen did not trade on that day. The option reached 50% profit zone in one week or two. If we took profit following the rules in Section 5 Exit Rules and Winner Management, then everything else would be simple for this position. Otherwise, it would be a rough ride. On May 7 with 14 days to expiration, the put option price was $7.4 with ITM probability of 13.2%, about 3.5 times of the originally sold price. With Karen’s winner management rules, the option would be let expire worthless for a maximum profit since it might not reached the adjustment point. Overall, the May put options did not appear to be in real danger when compared against June put options at the flash crash according to this analysis.


Now, let’s study the life of the June put options. There were 56 days to expiration for June options on April 22, 2010. This day and the next day were up days for market as shown in Figure 11: SPX Daily Chart of Flash Crash of May 6, 2010. So we could sell calls in these two days.
On April 27, 2010 the market dropped significantly and it was a good time to sell puts. We could sell 100 contracts of June $935 put with a 4.88% ITM probability (Delta = 4) following Karen’s entry rules described in Section 3 Option Selection and Section 4.1 Entry (Legged in) Rules. The bid/ask prices were $2.00/$2.90 (middle price = $2.45) and the volume was over 500. 
Additionally, if the some puts were sold some time before the close of market, the trade could have seen June $950 strike having ITM probability at 5% (5.68% EOD) and sold these contracts for a premium around $2.45. The end-of-day price became $2.90 for the strike which indicated a $0.45 loss on the day. By the way, the actual volume of this specific put strike on the day was about 1.7K, the 2nd largest quantity for OTM strikes of the day.

According to Figure 12: The Life of a 5% ITM Probability Put Option Survived the Flash Crash, the June $950 put option’s ITM probability would have approached 30% at the lowest point of the flash crash day.  But it was unlikely that it exceeded the 30% ITM probability too much, even if the position losses could be 7 times of the original premium received. If the Karen trader stayed calm, did not get scared by the big account loss at the moment and followed the adjustment rules, there would be no need to adjust this position.


However, most retail traders are likely to get close to panic in the market crash environment, because they would find a huge loss number at the profit and loss field of the portfolio and figure out that the loss on paper would take many months to a year to recover. They may start to forget about rules and disciplines and execute special trades that would ruin the portfolio later on. Karen gave some help on how to deal with such psychological issues as discussed in Section 8 Psychology and Mindset.

Sunday, July 28, 2013

Trade adjustments for the last couple of weeks

The market has been performed bullishly in the last 5 weeks. In the last couple of weeks, I had to make additional Delta adjustments for my non-directional portfolio. On 7-18, my portfolio SPX Beta weighted Delta reached more than -40. So I bought 90 shares of UPRO which is a 3x SPX ETF with equivalent Delta of 12 as shown in the chart below. As explained in my previous post, I used the ETF because I did not want to increase Gamma mainly.
This adjustment brought my Delta to the top limit of my acceptable Delta range, with 30 days to expiration. 2 trading days later (on 7-22), market continued its ascend. My portfolio Delta reached -50 so I had to make additional adjustments. The chart below showed a Delta of-65 due to a TOS SW issue. This was a Monday after a weekend TOS SW upgrade. The new version updated at last weekend did not show the 12 Delta of the UPRO. I was concerned about it and a few days later found the Delta field of UPRO came back.
On that Monday, I decided to close two most damaging positions of SPX (Iron conder) & RUT (double calendar) to make significant Delta reductions, because I had done many other adjustments already. In the end, I reduced my Delta to -27 as shown in the chart below. After that, the market had taken a 4 day rest giving me sometime to catch with Theta decay.
TOS software does not account for closed positions. So the realized loss for this cycle that is not accounted in the above diagram is about $2050. With about $950 profit shown in the above chart, the real loss at that date on paper is $1100.

As of today, it's apparent that my initial Delta adjustments were not big enough. I have to post my analysis of this month's adjustment later.


Wednesday, July 10, 2013

Continued to neutralize Delta of August option income portfolio


Yesterday, SPX rose to 1650 level, up $75 points in last 2 weeks. The SPX-weighted Delta of my non-directional portfolio reached -34 and the SPX price continue to move to the edge of the P&L zone as shown below. So I decided to make additional Delta adjustment, on top of my calendar spread adjustments on Monday.
I used a couple of verticals for both SPX & RUT to neutralize Delta by about 10 points. The short put options had Delta around -23 at the time of my order. I could have reduce the portfolio Delta even more, but I decided to wait since my technical outlook was still bearish near term as we had not seen a 2nd confirmation day yet.

If the market continues to rise, I might have to use a vertical debit spread to significantly reduce Delta in the next few days. For my position trade on SPY put, I may have to exit if SPY rose above $166 firmly as planned before.

Monday, July 8, 2013

Calendar Spread Adjustments to August Income Option Portfolio

As market continues to rebound in the last week, the SPX & RUT prices reached the edge of my August high probability income portfolio P&L curve as shown in the image below. The portfolio Delta was around 30, a little bit shy from my adjustment level around 36 as posted before.
So I used single call calendar adjustments for both SPX & RUT positions. The outcome is that the profitable zone is right shifted a little bit and the right edge is raised, while the portfolio Delta is reduced by 2 only. The larger Delta change shown in the P&L chart below was caused by the market price fluctuating in the downward direction at the time of my adjustments.
I decided to hold off more Delta adjustment today as the overall portfolio Delta is still in the acceptable range. I could use a few vertical put spreads to neutralize the Delta. But I wanted to spread my adjustments over multiple days as the market condition allows. If the market offers me higher Delta in the next couple of days, I would take action on the Delta.

Tuesday, June 25, 2013

Added a double calendar to August option income trade

I had built half of my August option inventory since last Tuesday. Today, I added the 3rd position to my August non-directional trading portfolio. Since my outlook is bearish right now, I used a double calendar on SPX with its profit zone towards the left side. Due to the relative high volatility in the market, I was able to select a $50 width without a major sag in the middle of the DC P&L chart as shown below. Normally, the span of DC is around 30 to 40 points.

The Theta of the original SPX IC reduced to around 2 as a result of recent market selling off, even though the half portfolio of August were still profitable at the moment. The added DC bumped up the Theta by 16 and changed Vega from negative to positive 68 which is helpful in bearish market.

There is one remaining position on RUT to be added to complete the August incoming portfolio. I plan to add another DC tomorrow with slightly different option strikes if possible, in order to spread the risk further. If that happens, the targeted profit income for the month will be around $800.

Wednesday, June 19, 2013

Started August non-directional trade with an iron condor

Yesterday was the 58th day to August SPX option expiration. So I started my 1st option premium selling trade for August and will continue to add August income trades to my portfolio in the next few days, pretty much one trade for each other day. This is a typical trade with short options of Delta around +/-0.23 for a credit of $6.65. I could have sold credit over $7.00 with other strikes of Delta 0.25. But I chose smaller credit for higher probability after looking at the resistance and support level.

If the market does not show any significant bearish signs, I'll use all iron condors for the August portfolio. Otherwise, I may use verticals and double calandars for it. On the 4th trade, I'll assess my portfolio Delta and consider adjusting the Delta with multiple trades that receive smaller credits. If that is the case, I'll also split the trade into two days in order to reduce the risks.

Currently, the SPX option chain still projects a higher possibility of downward movement in the future, since the average monthly volatility values are higher for longer time expiration series. We'll see if this term structure will be changed in the next few days.

Tuesday, May 21, 2013

Opening July SPX Iron Condor for non-directional option income portfolio

With 58 days to SPX expiration, it's time to get into a new option cycle. I tried to get $6.85 credit for the same IC yesterday but it was not filled as the market was falling in the later half of the trading hours. Today, market seemed to be rising slightly and the same order was filled in a couple of minutes at mid day.

I edited the chart a little bit so that it's easy to see the break-even levels, the option inventory and its Greeks, and the June probability in one chart as shown below. Again, I'll continue to build the positions in the next few days and the goal is to exit around June expiration time.
I gave the downside a little more room as usual among the conflicting market signals. This time, I think it's still possible to have a pullback for this extra falling room, even though the overbought market can also continue to be overbought for a while. The market has not shown the weakness that I'm looking for yet: distribution days in volume, churning of price actions, over-complacency as exhibited by lower VIX (VIX is not low when compared to the new high prices), etc.

Friday, May 3, 2013

Closing down of May SPX positions

Today market shot up with higher volume to demonstrate its bullishness and broke up the bollinger bands. My may SPX positions got killed badly. The portfolio Delta had reached -90 as shown in the image below.
I used the analyzer trying to figure out an acceptable combination of May option strategies for adjustment. But they all showed up very high Gamma and Vega as a result of calendars, since there are only 13 days left. So I had to close all of the May SPX option positions.

Additionally, I also closed the damaging RUT May option positions: a vertical and a calendar. I thought it was a really bloody day for me. But somehow, my real account had 2 more $940 and 2 more $960 calendars than what I had in the TOS chart. This was obvious a big mistake that I need to investigate. I had observed larger than expected differences in the real account P&L changes and the TOS analyzer. I had thought it was due to differences of brokers calculating option prices (using mid price or the worse price of bid or ask). Now, the mystery is resolved.

Anyway, the 4 extra calendars saved my account from a big loss. I added them back to the TOS analyzer as shown below. I have to close the May RUT positions pretty soon as there are about two weeks left.


Saturday, March 2, 2013

A Simple Review of Margin Requirement and Theta of the Karen-Super-Trader Strangle

There were some discussions on Karen (the Super trader)'s strategy about its ROM & Theta decay on average. To answer a reader's question, I spent a little time to analyze a regular strangle on TOS. With 47 days to expiration for April, the strange receives a credit of $5.25 as shown in the chart below. Somehow, the probability of expiration ITM shown in the chart is shown close to 20% on the upside. It contradicts the probability indicated at the trade page on TOS.
The Theta is about 70. I think it's close to the average $80 range as another commentator indicated, considering are many more days for Theta decay. I tried to analyze Theta decay in the analyzer but the analyzer chart showed some weird curves that I don't understand. So I have to ignore it for now.

The margin requirement for a margin paper account was real big. With the 10% probability ITM call and 5% probability ITM put strangle, the margin was a little over $24K I believe. So for a $100K margin account, we can sell 2 such SPX strangles with a margin requirement of about $50K. This is the initial capital used for opening positions. If an adjustment is made by selling another option, the margin will be around $75K, reaching the limit mentioned in the original interview. I think if SPY is used, the contract size will be that of the SPX times 10. Thus, SPY will offer more flexibility for capital usage for a $100K account.

In the IRA paper account, the margin field is illegal + 300 shares. I'm not sure what it means though.

Wednesday, February 6, 2013

Exiting Feb High Probability Positions to reduce Delta

Today in the morning, market appeared to fight back from an early drop. I could not see a major sign of market retreat at the moment. My market neutral option portfolio has delta reaching over -50 again with a Gamma of 4. So I decided to trim down the Delta by closing the most damaged IC of SPX which is shown below.
The remaining Delta was about -37 which was still too high considering we are close to expiration. It's shown below. So I also closed the most damaged RUT IC position.
After these two adjustments, the portfolio Delta was reduced to -13 as shown below. I'll see how market plays out in the next couple of days to close all positions for this month cycle.

Saturday, February 2, 2013

Exiting positions to reduce portfolio Delta

Yesterday, the markets rose after a short 2 day fall after the FED meeting. It appeared that the current FED is very market friendly and its announcements usually do not make market fall for long. It's still the same story of the FED announcements as I noticed before in my FED & VIX analysis. VIX made a significant drop as well.

In the mid-day, my monthly income portfolio had delta reaching a Delta of -74, with a Gamma of -4. The SPX iron condors were challenged on the upside.

So I had to make a Delta adjustment. With about 13 days to expiration, I had to close the most-damaged IC. The resultant portfolio Delta was -40. I'll close all positions by next Friday or close them early depending  on how market acts.

Wednesday, January 23, 2013

Reducing Feb portfolio delta

After yesterday's adjustment on SPX positions, the market continued to rise. Today, the portfolio had reached a Delta of -95. I considered it as too high for my portfolio. It had more than doubled the value of 36 for initial portfolio positions as I analyzed before, even though the current portfolio margin was about twice as the starting margin. So I reviewed existing positions and decided to close out the following IC which had its price close to the right drop-off point and a Delta of about 20.
After closing this IC with a minor profit, the overall portfolio still has a Delta of -75. The remaining Vega is about -325, equivalent to a Delta of 30 at the moment. Thus the effective Delta is around -45. I'll see how market does tomorrow to decide if any further action is required.

Tuesday, January 22, 2013

Iron condor trade adjustments to keep portfolio non-directional

With 23 days to SPX Feb option expiration, the SPX position P&L chart showed its price reached the adjustment point, since the market continued to push higher. Because the market has not pulled back for a while, I expected it to have a good chance to do that. So I decided to adjust only for the offending IC portion of the SPX positions.
To keep a similar profit potential, I had to increase the position size a bit. When playing with the 20 point wide and 10 point wide IC's of SPX on each side, I realized that the 10 point wide IC offered higher ROM (3.10/10=31% vs 5.15/20=26%). So I sold more 10 point wide IC on each side and closed the offending IC. In reality, it took a while to get the offending IC to be filled at 10 cents higher than the mid price of the IC.
The adjusted portfolio still have relatively high negative Delta, indicating the bias to a market pullback for it to become more profitable.

Thursday, December 27, 2012

Selling more premiums for Feb high probability portfolio

Market dropped in the last couple of days with higher volumes and the current intermediate uptrend is in danger. With volatility shooting up, I sold more premiums via February RUT and SPX iron condors with about 50 days to expiration.

Since market can drop rapidly and usually rise at a slower pace, I selected short strike prices in the following way: the short put strike had a delta around -20 as analyzed before and the short call strike had a delta around +24. This slight change in my strike selection rule is partially inspired by Karen's interview, and partially intended to reduce the effect of Vega of the high probability portfolio.

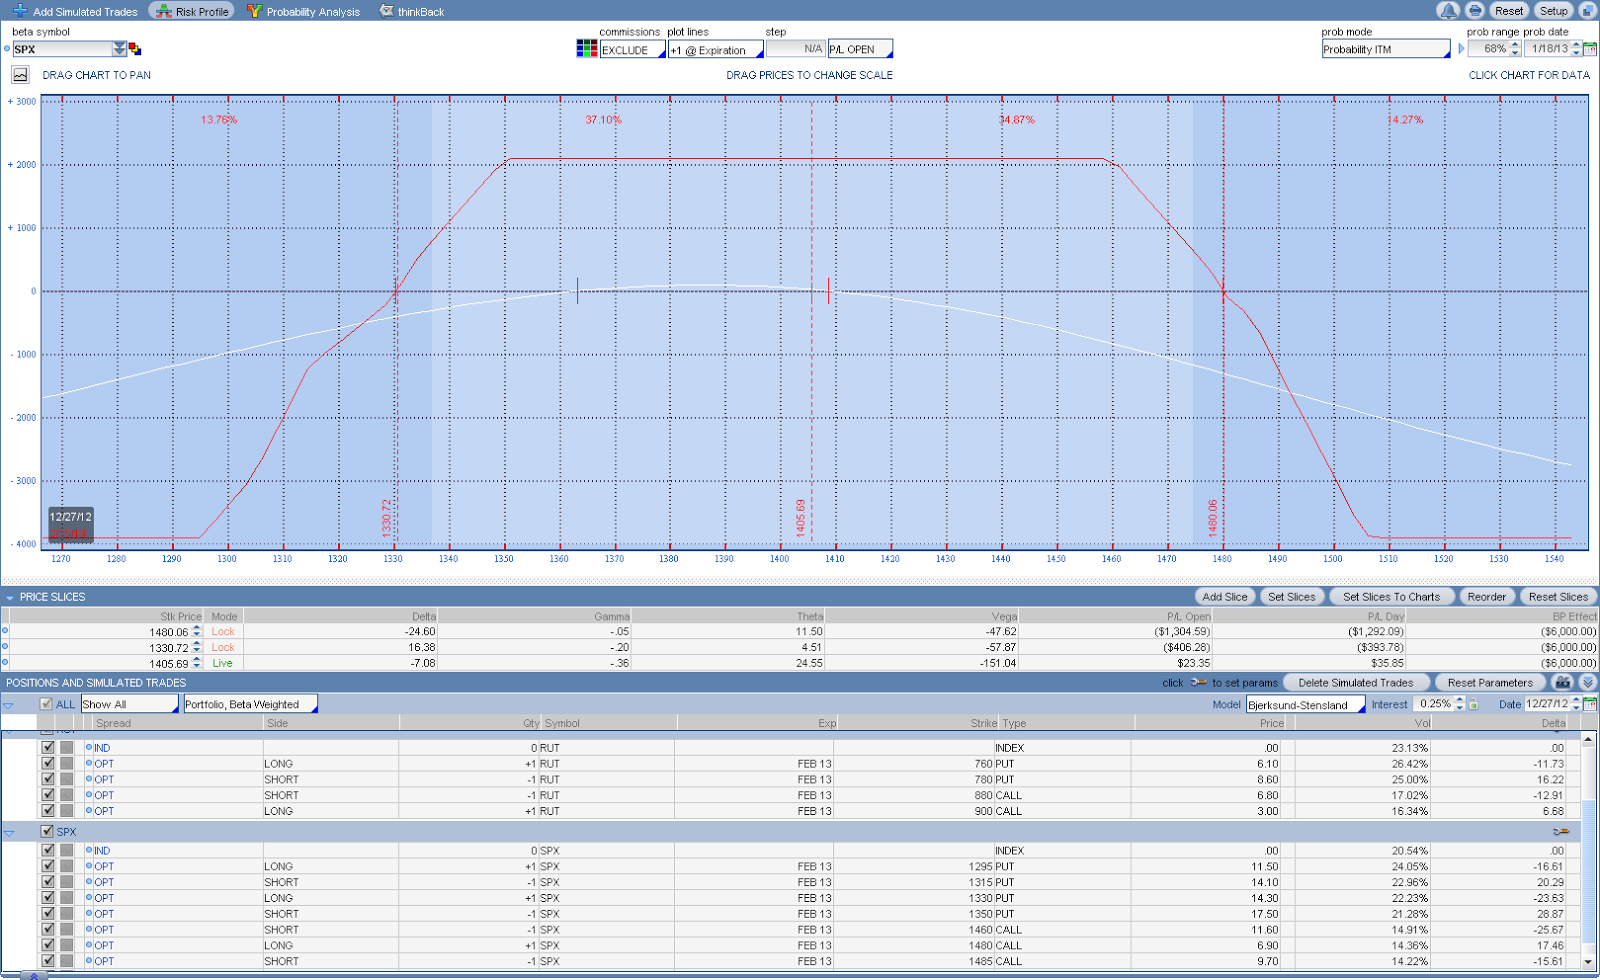
Using the above rule, I sold a RUT iron condor yesterday as shown in the graph below. IC's always have negative Vega, which favors reduction of volatility (market to rise). So the small negative delta of the position can neutralize the effect of Vega somewhat, making the position more market neutral.
Today, I also sold another SPX iron condor. My current portfolio has a Beta-weighted delta of -7, accommodating some down side market movements. The graph below recorded my current positions on RUT & SPX. I plan to complete my Feb portfolio tomorrow by adding another RUT time-decaying position.
To calculate how much Delta is needed to offset the Vega to obtain a market neutral portfolio, I used ATR to correlate Delta and Vega of SPX in the following way. Currently, SPX has ATR(30) of 14.3 and VIX has ATR(30) of 1.2. If the weighted SPX Delta x ATR is in the same range of VIX ATR x Vega, then the portfolio is about neutral. Thus, the Vega should be around 10 times of Delta to maintain the neutrality.

As an example, my Feb RUT IC has Vega of -47 and Delta of -5.3 is in the above range, making it perfectly market neutral. My 1st Feb SPX did not opened in this way while the 2nd SPX IC did. In the future, I will follow this rule when I intend to build market neutral portfolio in sideways market.

Friday, December 21, 2012

Sell to open SPX FEB Iron Condor and EEM Jan$44 Call

With about 2 month to Feb expiration, I sold an iron condor spread of SPX today as market tanked in monster volume (partly due to quadruple witching expiration of options and futures). My premium sell order for the SPX spread was 10 cents below the mid price as usual. It got filled immediately. The target exit time is 1 month later. The delta of the short strikes were around 23, presenting a high probability (66%) of ITM by Jan expiration time as shown in the graph below. I plan to add to my Feb option inventory every other day later until I complete all my positions of the Feb portfolio.

The volatility $VIX was very high in the last few days and it shot up more than 6% at this morning. Under normal cases, $VIX was supposed to be in the bottom level of its recent two month range, considering SPX was at the top level of its trading range. This type of divergence signaled there were heavy hedging going on against the fiscal cliff and there would be a big move in the market in either direction. So I sold Jan$44c of delta around 0.3 on EEM today to hedge the down side risk a little bit. I have June$40c opened a few weeks ago. So now I converted it into a diagonal spread.


Friday, December 14, 2012

Less expensive adjustment vehicles for Delta neutral portfolios

In this month (December) adjustments, I had to use SPY to adjust my delta without impacting Theta and Vega. Buying 200 shares of SPY would cost about $28,000 at current market level. It requires a lot of buying power. So I played with the double long ETF for SPY: SSO and triple long ETF: UPRO in the TOS analyzer, in order to reduce the buying power impact during adjustments. I found SSO (~$60) appeared to be a nice replacement vehicle for the adjustments. It costs less than half of the SPY and can produce a SPX delta of 8.4 for 100 shares. So overall, the buying power requirement can be reduced by about a half using SSO. For some reason, the triple long UPRO could not be used in TOS analyzer as it does not show any delta value.

If negative delta adjustment is needed, I would expect the SPY double short ETF SDS would work similarly. It's around $55 at present. I plan to use these two ETF's as adjustment vehicles in the future.

Tuesday, December 11, 2012

Rolled up SPX Iron Condor in high probability paper portfolio

Yesterday, my paper portfolio testing 2 month high probability, market neutral strategies showed a delta of -39 and prices went to the right slope of P&L chart. So I reviewed the positions and found the SPX Iron condors required adjustment.
My adjustment goal was reducing Delta while maintaining similar profit if possible. To buy back the $11.40 IC and sell the new $10.05 IC, I had a deficit of $1.35. Thus, I also rolled up the $1.05 put spread (debit) to a new  $3.05 put spread (credit). In this way, the overall SPX roll gave the portfolio an extra credit of $0.65 which offsets the transaction costs and commissions.
After the adjustment, the P& L Chart looks like below. It still has a delta of -27, a bit higher due to the RUT positions.

Monday, November 12, 2012

Fixing an error in trade order for smooth portfolio

I started to build up my December option inventory in the last couple of trading days. But I made an trade order error when placing an order for SPX IRON Condor: my new long strike of Dec$1445c happened to cancel my existing short strike Dec$1445c. I noticed it after the order was filled and the P&L dropped a couple of hundred dollars in the analyzer. The margin requirement also increased $2000 more than what's normal. So I did two more verticals to get the margin back to normal and formed two IC for the SPX position. This error will probably cost the portfolio around $100, considering the transaction cost, commissions and market price drifts.
I know it would be an error. But I forgot to examine existing positions today. To reduce this type of errors in the future, I'll add a specific trading rule: when creating new orders, I must review existing position and make sure there will be no deletion of existing positions. It must be part of my order review process.