
Showing posts with label position trade. Show all posts
Showing posts with label position trade. Show all posts
Sunday, November 26, 2017
Failed Head and Shoulders Breakdown on FXE
Interest rate sensitive stocks reacted to dovish FED meeting minutes in the last few trading days. In general, 30 year bond ETF TLT rose and broke its head and shoulders bearish pattern. Its stock chart did not confirm the head and shoulders breaking down either, as the Euro currency ETF FXE did. However, FXE's breaking down was short-lived. It started to stabilize and generated a sideways and upward bias as shown in the chart below. Although I got a chance to hedge the changing of direction with a short put and collected a small premium, FXE shot up on last Friday, forcing me to exit this trade as it broke above my stop loss point.
 Other banking stocks were a bit weak as well. BBT fell below its lower up-trending line support as well. So I decided to exit last Friday.

Tuesday, October 17, 2017
Is market approaching a top?
The general market SPX has been going up since August 21 for about 2 months now. Although it had rested two times (in which each lasted only 1 week) since then, this 2 month period probably outlasted the average 1 month rising period this year. There is no major sign of a market top at this point, as the SPX price continues to grind up and market distribution days are rare. However, the MACD indicator is showing losing momentum.
Based on the behavior of small upward daily movement of the SPX prices since last week, the indicators and the higher than average number of rising uptrend days, I'm preparing for the end game for this market cycle for my positional trades. Basically, it means watching stock prices closely with relatively tight exit points to take profits and waiting for a market rest before fully entering new positions. According to Mark Douglas's book titled "Trading in the Zone", one of the seven principles of consistency in winning stock market is "I pay myself as the market makes money available to me". This is similar to my posting before on winning altitude. Therefore, I need to take profits gladly for this market cycle, as a number of stocks in my portfolio gained within or beyond my expectations.
In general, the last 4 weeks were probably very good time for most traders, since the market kept moving up. All of my positions are doing well except a couple of them that got stopped out. The only bearish trade (HOG) that I entered while market gave some bearish signals ended as a loser as market resumed uptrend within a few days after my entry. The Indian stock ETF EPI was a biggest percentage loser in over 1+ year's trading for me. It was the worse case scenario in my stop rule if the stock kept gapping down for more than 2 days. Looking it at the probability point of view, one big loss trading is still OK as my winning and losing distribution is quite normal up to now. I'll present more statistics later.
 I also closed two positions which were big winners last Friday. NFLX was doing well up to one day before the earnings announcement. My exit rule requires me to exit before earnings day to keep my P&L smooth. So I was happy to take the good profit percentage. PYPL reached my target area as the high of the day and retreated from there. Considering its earnings announcement is coming soon, I decided to take profit off the table. The PYPL chart was posted on StockTwits and is shown below.
 My other stock positions include BIDU and EDU. Their earning announcement days are coming next week. So I need to take them off soon as well.
The only new position I entered after the last post was the XLV June, 2018 $79 call for a cost of $5.88 on 10-2. I felt health care could resume its recent uptrend after some rests, if the market rotates to sectors that made less progress this year. So I bought the call after XLV rebounded from a major support level around $81 as shown in the chart below. However, it hit the prior resistance at $83 and started to retreat. I could have sold a short call as a hedge yesterday after a two day declines in a roll. But it was actually trading higher when I was watching the stock price yesterday. Since XLV shot up to form a new ascending triangle breakout today, I don't need to short the call any more.

Based on the behavior of small upward daily movement of the SPX prices since last week, the indicators and the higher than average number of rising uptrend days, I'm preparing for the end game for this market cycle for my positional trades. Basically, it means watching stock prices closely with relatively tight exit points to take profits and waiting for a market rest before fully entering new positions. According to Mark Douglas's book titled "Trading in the Zone", one of the seven principles of consistency in winning stock market is "I pay myself as the market makes money available to me". This is similar to my posting before on winning altitude. Therefore, I need to take profits gladly for this market cycle, as a number of stocks in my portfolio gained within or beyond my expectations.
In general, the last 4 weeks were probably very good time for most traders, since the market kept moving up. All of my positions are doing well except a couple of them that got stopped out. The only bearish trade (HOG) that I entered while market gave some bearish signals ended as a loser as market resumed uptrend within a few days after my entry. The Indian stock ETF EPI was a biggest percentage loser in over 1+ year's trading for me. It was the worse case scenario in my stop rule if the stock kept gapping down for more than 2 days. Looking it at the probability point of view, one big loss trading is still OK as my winning and losing distribution is quite normal up to now. I'll present more statistics later.

The only new position I entered after the last post was the XLV June, 2018 $79 call for a cost of $5.88 on 10-2. I felt health care could resume its recent uptrend after some rests, if the market rotates to sectors that made less progress this year. So I bought the call after XLV rebounded from a major support level around $81 as shown in the chart below. However, it hit the prior resistance at $83 and started to retreat. I could have sold a short call as a hedge yesterday after a two day declines in a roll. But it was actually trading higher when I was watching the stock price yesterday. Since XLV shot up to form a new ascending triangle breakout today, I don't need to short the call any more.

Wednesday, September 13, 2017
Middle Game Review of Bullish Portfolio Positions
It looks to me that the positional stock trading has
similarities to the chess games. Position entries are like the chess opening.
Position management after that is like the middle game as the market battle unfolds with
various types of market and stock signals. Profit or loss taking is like the
end game of chess where the individual game completes. This process should
continue for a long time for consistent traders.
Since market hit its intraday bottom at August 21, there
were a few bullish signals shown by the SPX chart pattern. I have switched to
bullish outlook as mentioned in the last blog post. In the subsequent weeks, I
entered a few more bullish positions. I think that’s enough for my portfolio for now.
The opening game is done. Let’s have a review of the current positions as a middle
game assessment.
On the HOG trade, it’s interesting to see two bearish
patterns got invalidated and the stock refused to go down. However, the stock
has yet to rise beyond my original stop point of $48.27. With 2 days to expiration, I bought back the
short September 15 $46 put contracts for $0.06/each today to take a profit of $0.48
(=0.54-0.06) on the short put. I need to change my stop point to $47.85,
somewhat above previous high after I entered the trade based on its resilient
behavior.

On September 1, I entered March 16 $220 call on BIDU as
mentioned in the last post. Since then, it was doing well as shown in the chart
below.

On September 7, I entered a long call January 19 $57.5 on
PYPL for $6.75 as it was breaking above a 6 day high base within an up-trending
channel as I posted on StockTwits. In the last couple of days, it pulled back
to touch the high base again. If it fells tomorrow, it will trigger my signal
to sell a short call.

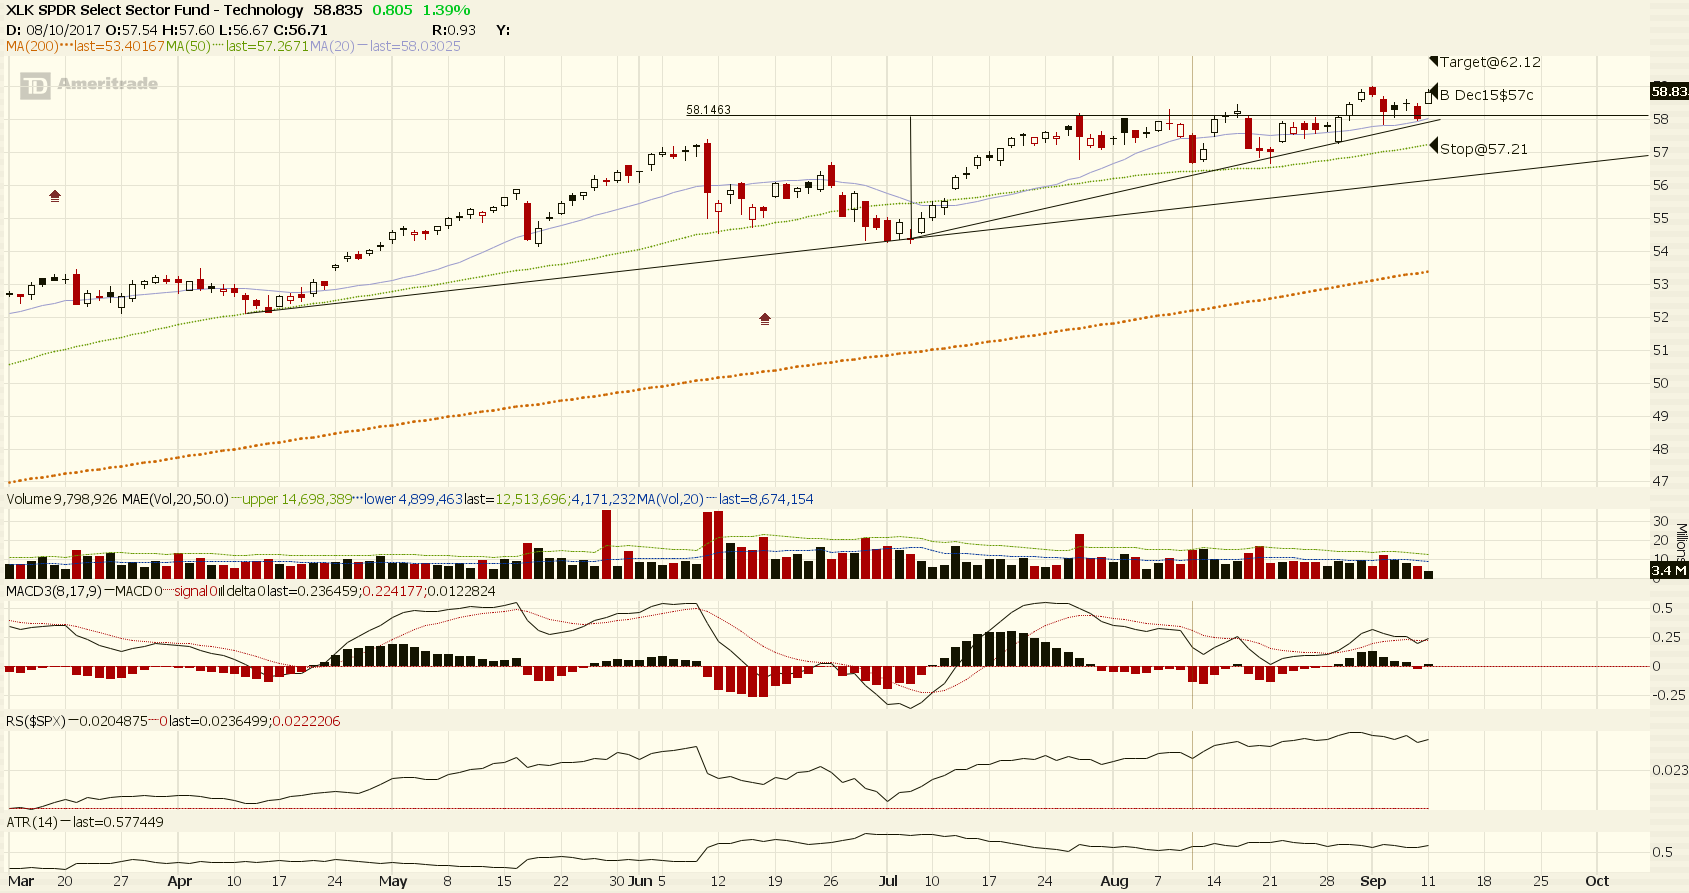
On September 11, I entered a December 15 $57 call on XLK at
a cost of $2.90 for a near term trade as it bounced back from support level as
shown in the chart below. It looked like a bull pull-back trade on top of an
ascending triangle breakout. My plan is to trade the larger ascending triangle
pattern. I also entered longer term trade with June 15, 2018 $56 at the cost of
$4.95 in a different account.
Yesterday, I bought EPI Jan 19 $26 call for $1.50 after it
broke out of a 6-day high base within an upper trending channel as shown in the
chart below.

Overall, the market has been bullish for the last 3 weeks.
However, it should be noted that the market rose for about 3 to 4 weeks then
pulled back in the last 6 months. It happened 3 times in this time frame signaling
some fatigues of the long bull market since the up run could not last longer. We’ll have to see what market signals
tell us next as the middle game continues.
Thursday, August 3, 2017
Closed EEM Long Calls to Take Profit as the Option Delta Reached Target
Yesterday, I
closed the EEM long call (2018 January 19 $38 LEAPS) when EEM was dropping near
its $44 resistance after I found out its Delta reached 0.86 which was over the
target of 0.80 as described in the original post (Bought
top performing emerging market ETF) when the position was entered over 3
months ago.
I did not
roll out the long call to take profit and to remain in the position, because
EEM had been rising in the up-trending channel in the last 5 months as shown in
the chart below. I’d like to wait for the next EEM opportunity when it rests
for a while.

Looking at
my last trades on EEM, I had got out of a short call July 7 $41.5 on June 26 as
it popped out of an ascending triangle as I described in
a chart of a prior post and shown below. Since then, EEM pulled back to the triangle but
did not trigger a new signal for selling another call. So, I was lucky to
capture fast move of EEM in the last 4 weeks.

For EPI long
stock position, I’ll continue to follow my plan to exit when it breaks 20+ day
support that I identify along the way and the profit target exit will be the
uptrend shows signs of ending or when the general market start to show weakness.
During my
multi-week summer vacation, I had a few trades on the SPY & QQQ while I
kept a minimal number of positions. I’ll document those trades later and look
to expand my positions as market conditions allow since I’m back and able to
handle the portfolios actively.
Friday, July 7, 2017
Taking profit on ascending triangle breakout trade in choppy market
General market $SPX continued to drift down in the last 3 weeks while Nasdaq fell below its 50DMA this week and it made a lower high/lower low bearish pattern in last 4 weeks. In this choppy market environment, my trading style requires low market exposure and lower number of trades to control risks.
Today, market is rebounding up with lower volume. My ascending triangle breakout trade on C diagonal spread showed some profits after the price of C got close to target price of $69.19 in one month, which was much faster than expected. Considering I have to take a multi-week vacation and the choppy market, I decided to close this positional trade for an acceptable profit.

Also on yesterday, the short call July 7 $244.5 on SPY reached $0.02 to create a good profit as $SPY moved sideways most of time, as shown in the chart below. So I bought it back and sold a new July 28 $244 call for a credit of $1.02. I plan to hold this long term diagonal unless SPY 10 week EMA crosses down 40 week EMA.

Today, market is rebounding up with lower volume. My ascending triangle breakout trade on C diagonal spread showed some profits after the price of C got close to target price of $69.19 in one month, which was much faster than expected. Considering I have to take a multi-week vacation and the choppy market, I decided to close this positional trade for an acceptable profit.

Also on yesterday, the short call July 7 $244.5 on SPY reached $0.02 to create a good profit as $SPY moved sideways most of time, as shown in the chart below. So I bought it back and sold a new July 28 $244 call for a credit of $1.02. I plan to hold this long term diagonal unless SPY 10 week EMA crosses down 40 week EMA.
Now, I have closed all of my near term trades in preparation for the vacation in which I'll have much less time to watch over market. The remaining open positions are longer term and I'll continue to sell calls or buy protective puts should the market turns bearish.
Thursday, June 29, 2017
Reducing bullish positions amid weakening market postures
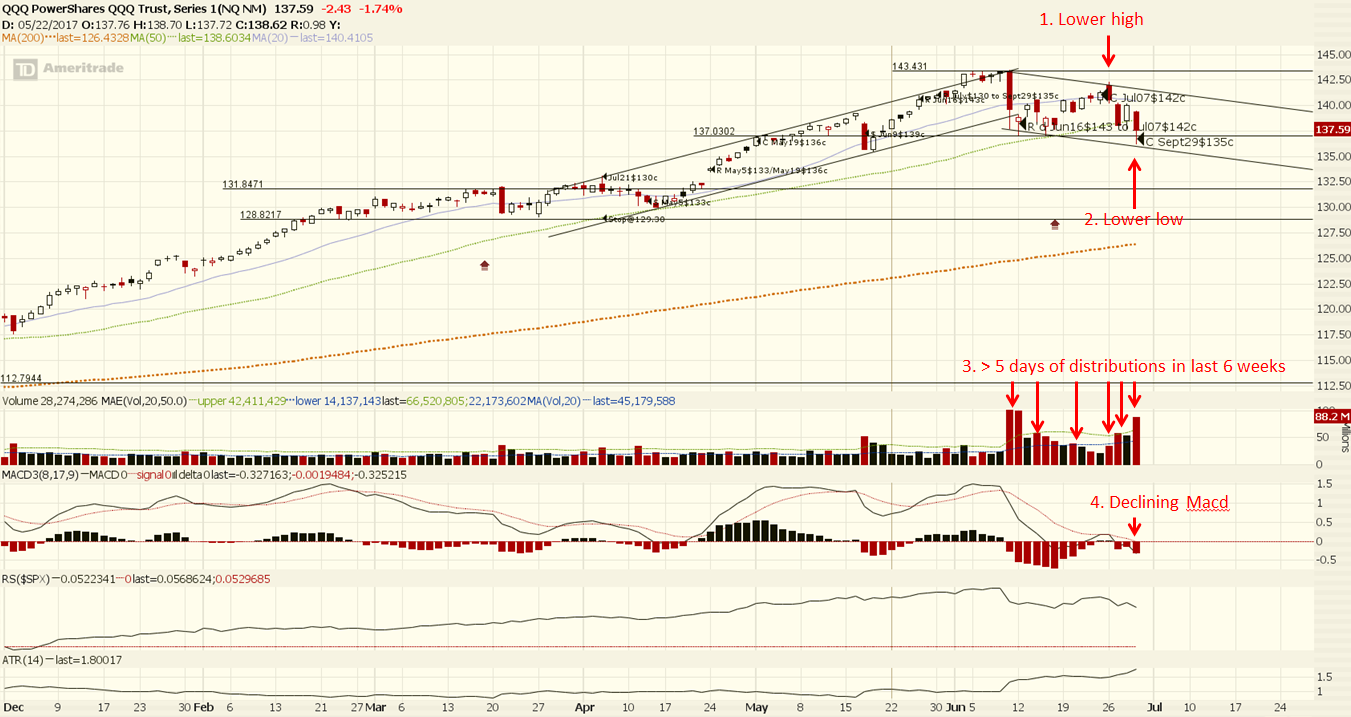
QQQ had turbulent
4 days after I uncovered its short call on last Friday June 23. On the
subsequent Monday of June 26, QQQ presented a bearish dark cloud cover candle
and fell hard for the next day. It tried to rebound on the 3rd day
/w lower volume. On this 4th day, it got hammered again on high
volume and undercut the support line around $137.
Looking at other
QQQ chart indicators that I use typically, MACD turned down for the again but the new high – new low indicator is still up. Since QQQ
showed me the bearish chart pattern, declining MACD and the distributive volume
behavior, I decided to sell to close my QQQ September 29 $135 call in my
shorter term trading account today for $5.73. For my longer term trading
account, I sold the July 21 $140 call for $1.01 against the long option. The short call strike had Delta around 0.30
which reduced the position delta as a hedge procedure.
On the SPY
side, it was sold off today too. However, it had not broken down the lower support
line of the up-trending channel yet. I have a July 7 $244.5 call which still
has a value around $.20. I plan to roll down if SPY continues to fall tomorrow.
It’s not a complete market plunge as the financial ETF’s XLF/KRE did rise.
Citigroup
popped out of recent range along with its peers in high volume. I rolled up the
July 7 $66 call to July 21 $69 Call for a debit of $0.94, rather than make it
naked. My thought was that the weak market may limit the rise of financial
stocks as well.
For MU
diagonal spread, I exited the position for a credit of $5.32 two days ago on Tuesday
June 22, after it touched the recent high and pulled back. My rule is to exit before
its earning’s announcement which happens to be today. This rule is used to
reduce risk of my portfolio.
For EEM, it broke out of resistance on Monday, June 26. I bought back the short call July 7 $41.4 for $0.60. Since that, it pulled back but the MACD hasn’t dropped for 2 days in a roll yet. I may have to short another call if EEM price drops tomorrow.
Sunday, June 25, 2017
Trades for the last 2-week side-ways market and current outlook
In the last
couple of weeks, the stock market experienced a NASDAQ sell-off, followed by
some recovery days. The SPX moved sideways mostly. Overall, the general market looks
bullish as the up-trends are still in place. Even with the 2-day big Nasdaq
selloff, the NASDAQ
New highs – New lows index remains rising.
As explained
in my
post about my usage of this secondary confirmation index before, I decided
to uncover the QQQ July 07, 2017 $142 Call for a price of $0.98 on Friday, June
23 based this and the following bullish signals. The chart indicated rising MACD and QQQ also
successfully bounced off the support line around $137 two times.
Looking further
back on Monday, June 12, QQQ continued to sell off after its prior Friday’s
plunge. The short call of June 16 $143 sold
on May 25 as a hedge reached most of its profit as its price reduced to $0.12.
Therefore I rolled it out and down to July 07 $142 Call which was sold for
$0.84 as shown in the chart below.

Now QQQ sits
at the same price level as that in 4 weeks ago. I’m glad that I followed my
rules to take some profits off the table and used short calls to hedge for a
possible change of uptrend in this period. It was not easy actions for me since
they were done in the middle of strong uptrend.
Taking profits for positional trades are necessary and takes the greedy part of trading psychology out of the trading process.
However, I
was not as quick on the NLFX & MU trades as I did for QQQ before the Nasdaq
sell-off. A couple of days before the sell-off, the Delta’s of long calls on these
stocks reached slightly higher than 0.80 as well.
My trading
rules specify that rolling for long term trades and closing for near term
position trades when the Delta reaches over 0.80, not necessarily at 0.80
though. I was hoping to get Delta’s rising to 0.85+ level amid the strong
market trend. So I did not take any profits off for these positions and saw the
profits evaporated during the sell-off.
On Thursday June
15, NFLX dropped intraday to undercut the prior 3 day lows which caused me to
sell the long call of September 15 $154 for $13.2. It was bought on April 25
for $15.60. So the net loss excluding short call and its rolls on this position
held for about 2 months is $2.40, down 15%. I’ll have to calculate the actual
loss later when time allows.
At present,
I still have the following open positions. I plan to close MU before its June
29 earnings announcement date this week as my rule does not allow holding the
earnings date in general.
|
Stock
|
Existing
Position
|
Note
|
|
SPY
|
Long Jan. 19, 2018
$220 Call LEAPS, short July 7 $244.5 Call
|
Sold short call on
June 15 for $0.76 as SPX & Nasdaq sold off.
|
|
QQQ
|
Long Sept. 29 $135
Call
|
Uncovered short call
on June 23
|
|
MU
|
Long Oct 20 $27 Call,
Short July 07 $33.5c
|
Sold short call on
June 15 for $0.83 as Nasdaq sold off.
|
|
EEM
|
Long Jan. 19, 2018
$38 Call LEAPS, short July 7 41.5 Call
|
Sold short call on
June 15 for $0.25 as Nasdaq sold off.
|
|
C
|
Long Sept. 15 $60
Call, Short July 7 $66c
|
Sold short call on
June 15 for $0.54 as Nasdaq sold off.
|
Saturday, June 10, 2017
Ascending Triangle Breakout Trade on Citigroup & Current Market Outlook
On Thursday,
the general market was moving sideways for the 4th day. But the
financial stocks were the best performing sector mid-day. The financial ETF XLF
broke above the 50 day moving average with high volume after living under it
for over 2.5 months.
Citigroup C was a
member of the ETF. I noticed it was a leader in the group a couple of weeks ago
since it seemed to be in the process of forming an ascending triangle
pattern while other financial stocks were trending lower and testing lower
support levels. On Thursday, C broke out of the resistance level around $62.65
with high volume.

The pattern
before the breakout lasted about 11 weeks. So I added a couple of weeks more for the expiration date and chose September 15, 2017 Call with a strike of $60 which had a Delta of
0.70. It was higher than my desired Delta of 0.62 but it was the next higher
Delta that was above 0.62 for the September call options. I started with limit
order at $4.78 and watched the price going higher. I kept raising my limit
order little by little and eventual got filled with $4.85 within 10 minutes.
My mental
stop loss point was set to $59.78, which was slightly below the swing low 7
days ago and the 50 day moving average. My target prices of the stock was $62.56*(1+10.6%,
percentage of the rise in the pattern) = $69.19. The calculated Reward/Risk
ratio was close to 2 for the stock trade. When the stock prices reach these points, I
plan to take actions to sell the call option. As usually, I will leg into a
diagonal from this naked long call when the stock shows the signal of pulling
downwards.
Overall, I’m
still mildly bullish for the general market, even with the huge sell-off in the
NASDAQ today. The 2.5% plunge of QQQ today was much larger than that on May 17,
about
3 week ago on the scare of presidential impeachment. Friday's tumble was accompanied by
the largest volume since the starting of this round of uptrend in December,
2016. This is a serious concern for the market health.
However, the
SPX and Russel 2000 indices were still doing OK on Friday. There were other
sectors (XLE, XLF, etc) rising significantly. So it did not look like a broad
market sell-off yet. The accumulative new highs – new lows indicators
mentioned in
my previous post did not drop yet. If there are
more bearish signs on the market next week, I’ll take necessary actions.
My positions
in different accounts are all bullish at the moment, although I kept my open
positions relatively small for now. I also have short calls on my SPY & QQQ
long calls as hedges as described in
my previous posts. Now, I felt compensated on my action to follow my
trading rule and to take some profits on June 2 when the markets broke above
the upper line of the trading channel as I describe in my post: Closing
Trades to Take Some Profits as Market Broke above Upper Boundaries.
Since the
SPX had already rested and moved sideways from early March to early May for 2
months, I think it could continue to advance for another month which is July,
unless market shows other signs of a major top. I plan to have a vacation in July. So I need
to keep the number of positions small for now from this perspective.
Friday, June 2, 2017
Closing Trades to Take Some Profits as Market Broke above Upper Boundaries
The stock
market continued to show bullish strength today by crossing the 2 month long upper
line of the up-trending channel by SPY & QQQ and above the upper Bollinger
band, as shown in the charts below. The NYSE & NASDAQ trading volumes were
lower than those in yesterday. It was a difficult time to take profits since
there were no visible signs of market weakness based on price patterns.

However, the
exit rule of my diagonal spread for my positional trades was met today for some
of my positions. Basically, the rule specifies that when the Delta of the long
option exceeds 0.80, the diagonal spread can be closed for profits for
positional trades and rolled out for longer term trades. The high Delta value
and the crossing of the upper boundaries made me to decide to close some SPY
& QQQ positions for profit. I’ll wait for a few weeks to see if there are
new entry points on these ETF’s and manage remaining positions as market
evolves.
The entry,
rolling adjustments, and exits of the QQQ December 29, 2017 Call which was a
position in a different account from the last post is shown in the chart above. The summary
of the QQQ diagonal trades is listed in the table below. In reviewing the
trades, it’s obvious that I had held the short calls for too long such that the
overall profit was 28% only while the targeted profit could be 50% or more.
|
Date
|
Spread
|
Side
|
Exp
|
Strike
|
Price
|
Net Price
|
Total Cost
|
|
4/5/2017
|
SINGLE
|
BUY
|
29-Dec-17
|
127
|
10.63
|
10.63
|
10.63
|
|
4/12/2017
|
SINGLE
|
SELL
|
5-May-17
|
133
|
0.79
|
0.79
|
9.84
|
|
4/24/2017
|
DIAGONAL
|
SELL
|
19-May-17
|
136
|
0.58
|
-1.14
|
9.26
|
|
4/24/2017
|
|
BUY
|
5-May-17
|
133
|
1.72
|
DEBIT
|
10.98
|
|
5/1/2017
|
SINGLE
|
BUY
|
19-May-17
|
136
|
1.81
|
1.81
|
12.79
|
|
5/17/2017
|
SINGLE
|
SELL
|
9-Jun-17
|
139
|
0.83
|
0.83
|
11.96
|
|
5/25/2017
|
DIAGONAL
|
SELL
|
16-Jun-17
|
143
|
0.49
|
-1.92
|
11.47
|
|
5/25/2017
|
|
BUY
|
9-Jun-17
|
139
|
2.41
|
DEBIT
|
13.88
|
|
6/2/2017
|
DIAGONAL
|
SELL
|
29-Dec-17
|
127
|
18.03
|
16.86
|
-4.15
|
|
6/2/2017
|
|
BUY
|
16-Jun-17
|
143
|
1.17
|
CREDIT
|
-2.98
|
In the
meantime, I decided to keep 1/3rd of the QQQ diagonal spread for
longer term trade. Since the December 29, 2017 $127 Call has its Delta about
0.82, I rolled out 3 more months to March 16, 2018 and raised strike price to
$136 which had Delta around 0.65. As explained in the previous post, the
rolling reduced the overall position Delta. I might need to adjust the short June16
$143 call if QQQ keeps rising.
On the SPY
bullish positions, I sold diagonal call spread September 2017 $229/June 2017
244.50 Call for $15.31 as the long call had Delta over 0.80 as well. I’ll
analyze the SPY diagonals in the future in a trade review.
My other
diagonal call spread on MU was adjusted as well since the short call Delta
reached over 0.65 and MU price action was strong. Thus, I bought back the June
9 $30.5 call and left the October 20 $27 call which was bought around May
11th naked. The MU stock chart is shown below.

Subscribe to:
Posts (Atom)