Pages

Saturday, November 22, 2014

Worthless puts saved overall positions during the fast sell-off in October

As I have been testing water with my new option selling strategy inspired by the Super trader Karen, I started with TBT as described in my September post. Since then, mistakes had been made and some quick profits were earned as shown in the chart below. More importantly, lessons were learnt during the live trades.
In my October post, the TBT trade was going on according to plan. I did not realize that I had the best opportunity to close all the trades to achieve the maximum profit around 9-18 as shown in the chart above. I thought the far OTM puts were expire worthless as TBT was turning into a up trend. However, it did the opposite, and broke down my support level of $54. On 10-7, I settled to take a 50% profit by buying back Oct$53 put. There were no bids for Oct$49p at the time so I had to leave it on (I was not able to close the position as a spread trade) with only 2 weeks to expiration. It was the far OTM, worthless straight put that saved the overall position several days later when TBT crashed around 10-15 along with the stock market. As mentioned in the previous post, that was a test of 3 SD event. The other bull put position Oct$51/46p got crushed as price tumbled from $51.2 to $48 just 2 days before expiration. I decided to close the straight put which become ITM by selling it and the short bull put spread by buying it back, for a small profit on the crash day.

I think it was this small profit that gave me a little bit of psychological boost to follow my trading rule to hold on to the TLT position which was suffering a temporary loss that was over 3 times of potential MAX profit at the time. I did not look at the intraday loss and felt OK since I had a good amount of capital available in the account for possible rolling adjustments.

As happened many times in strong bull market before, the market sell-off was short lived. The market rallied back quickly. I strongly believe that bulls would not die without a big fight. For 5 weeks after the sell-off, market kept advancing. My TBT bear call spread Nov$57/62c (C5S/C5B in chart) was expired worthless last Friday. Now, I'm out of all TBT positions and transitioned fully into TLT trades as planned.

So what are the lessons to be learned from the market and the trades? This is the tough part of the trade review. With the help of the chart that recorded the trades, I think the following points are important for me.

  1. After entering a trade for 1 month and with 1 month left for expiration, the trade may be exited for minor profit or loss if the stock prices goes against the position in general.
    • I could have exited positions around 8-14 to open new positions.
  2. Need to make sure adjustment sizes to be correct so that the potential profits remain the same.
    • Made a mistake around 8-15
  3. Should take deep profits as the stock starts to change direction around major support/resistance levels
  4. In a weak market, it may be worth to long really cheap ($0.05) OTM puts when key support level is broken. The contract sizes should depend on the long term bullishness of the market.
    • Trades on 10-7 was perfect as market broke down the support level.
  5. It's OK to follow the rules to adjust around Delta of 0.65.


Monday, November 10, 2014

Surviving a test of 3 SD event on TLT bear call spread trades

When I started to test my new premium selling strategy using TLT in middle to late September as described in my previous post on my positions on TLT & TBT, I had no idea that a 3 Standard Deviation test would soon appear. In fact, the 1st trades near middle of September were easy: 50% profit in 4 days as shown in the diagram below. At that time, FED announced end of QE. I thought TLT would start going down which was totally wrong as TLT continued to rise and shot up far beyond a 3 SD point at an intraday period.
Apparently, my short position of Nov$121/126c was in trouble as soon as it was opened. By Oct. 13, I began to realize that the uptrend of TLT was still intact as it firmly stayed above the $119 resistance level that I had in mind. So I began my adjustments and sold a larger number of bear calls of Nov$125/130c to make up possible deficits of existing losing position. The Delta of the short call strike Nov$121c reached my adjustment level of 0.65. So I rolled up and out the trade. On Oct 14 which was one day before the big 3 SD test, TLT broke up even further away from its upper Bollinger band. I had an opportunity to close the Original Nov$121/125c position and my sell order for Dec$127/132c was filled. I thought the price of TLT was pretty extended on that day. Then the big surprise came as market had a mini-crash and TLT sky-rocketed to test the 3 SD price. As usually, I watched market for less then one hour that day around Wall Street's lunch time. The Delta of my short strike Nov$125c were below 0.65, my adjustment level. Although shocked, I did not make any adjustments for TLT on that day. Well, the price started to move down which was what my positions favor since then. I think I was lucky to exit all the positions with 50% profits about 2 weeks later.

In retrospect, I think there are a few lessons learned from the adverse test for the high probability option selling strategies:

  • Don't panic in the market extreme events and use trading rules to guide the reaction
  • Trade a strategy only if you feel confident about it
  • Keep sufficient capital to fight the adverse events (I'm still working on it)
  • The high probability strategy can have large temporary losses (3 x potential profit this time)
  • Profits can be earned even if price projections are wrong at times
  • Refrain from over-adjustments

I had the thought of making adjustments if TLT reached and stayed above resistance level of $119. Had I done it, I would have sold TLT calls with lower strikes which would gave me larger temporary losses. It would be a bit more difficult to reach the 50% profit with the lower short call strikes. After reviewing my trades here, I think I should stick to the adjustment rule based on the Delta of short strikes, rather than support/resistance levels obtained from technical analysis.

Sunday, November 2, 2014

Does 3 standard deviation move of an ETF match reality?

It was a fantastical test in the last couple of weeks for the premium selling strategy that I'm working on in both real and paper trades, as the market went extremely turbulent. It will take a while for me to digest the trades to firm up my trading rules.

In preparation to analyze my TLT trades as it ventured above the 3 Standard Deviation (SD) line intraday on 10-15, I studied the historical data. I think 3 SD corresponds to 99.7% probability approximately as I outlined in a post before. If I understand it correctly, there will be a 3 SD event every 1 year 7.5 months which corresponds to 333 (1/0.3%) trading days on average (assuming there are 200 trading days per year).

I'm interested how these numbers matching the reality. So I went through the TLT history using Prophet Chart available from TOS. I created the Bollinger bands with 30 day MA & 3 SD on TLT chart, scrolled through the entire price chart whose data started at 2002-7-26 for over 12 years. I found the follow 3 SD occurrences where prices closed outside the Bollinger bands by visual inspections only.

Number Date Days Up/Low Days outside 3 SD
1 7/2/2004 0 Up Just 1 day
2 2/27/2007 970 Up Just 1 day
3 11/20/2008 632 Up Just 1 day, but continued to rise
4 5/6/2010 532 Up Just 1 day
5 8/16/2010 102 Up Just 1 day
6 8/2/2011 351 Up 3 days
7 3/14/2012 225 Low Just 1 day
8 4/5/2013 387 Up Just 1 day

From 2004-7-2 to 2014-10-31, there are 4480 calendar days. That is a period of 12 years and 3 month. I equated it to 2460 trading days roughly. With the 0.3% probability, we should have 7.3 (2460 x 0.3%) occurrences outside 3 SD in the period. In reality, we've had 8 occurrences as shown in the above table. I think this is very surprisingly close to the theory.

I have a couple of other findings that should be recorded here.
  • 6 out of 8 times the price came back to Bollinger bands in the next day
  • 1 out of 8 times the prices fell below the lower Bollinger band
    • I guess there will be more events that the prices fall below the Bollinger band in the next 10 to 20 years.
I'm running out of time today. So I have to present my trade analysis (Lessons from surviving the test of 3 SD events) next time.

Sunday, October 5, 2014

Review of current (November) TBT & TLT positions

In the last month, I basically followed the ideas in the last post and tried to let the TBT options expiring worthless. Well, the short call Oct$62 did expire on 9-20 with a mild level of risk of breaking above the short strike a few days before expiration. But I decided to hold on and it worked this time. However, I may be facing another challenge on the Nov$53p (P2S in the chart below), as TBT pulled back significantly to my surprise. If TBT drops below $54, I will consider closing the sold put spread.
As part of my plan, I started using TLT for my future trades as it's more liquid than TBT. I thought TBT & TLT would change their long term trends after the recent FED meeting. I will consider the thought invalidated if the ETF's take over their previous support/resistance.

For the TLT, I sold Nov$109/104 put spreads on 9-17 as it was approaching the lower Bollinger band with a high IV about one hour before FED meeting announcement. 4 days later, the TLT rose to give me a quick 50% profit and I exited the trade (P1 & P2). To my surprise, TLT continued to rise. I waited for a few days and finally sold Nov$121/126 call spread. All the short options were of 0.20 Deltas and credits were above or equal to $0.50 for a 10%+ ROM.
If TLT breaks above $119 firmly, I may start taking some adjustment actions. But the short call options may not be rolled until a 0.65 Delta is reached.

Sunday, September 7, 2014

A review of my rolling adjustments on TBT

I sold option premiums on TBT in the last couple of months as TBT fell fast. Initially, I sold naked puts (P1S) of Delta 30 as TBT broke down its support line around $60. I planned to get assigned if TBT would drop below the sold strike as I had the view that interest rate would not continue to fall for too long. On the 2nd day after the opening short, I watched TBT failing to rebound and decided to sell bear call spreads to collect some premium on the down side. For about 4 weeks after that, TBT maintained a slightly downward trend and got a relative large increase of its implied volatility. Thus, there was not many premiums that could be materialized as shown in the chart below.

In the meantime, I developed a new general trading plan for selling premiums using some principles from Karen and some paper trades. It had enough rules for me to test it with the real money using TBT. So I started to trade it for the following occurrences. I also realized that rates may take 10 to 15 years to bottom historically. This puts the rising date to 2020 since we had a record low rate period.
Around 8-15, TBT broke down another level of support and fell hard. On that day, my short put had its Delta reached over 0.65 (which was my adjustment Delta). So I decided to roll it down to the next 30 Delta in the next cycle (October). I bought back the original short put and sold more bull put spread with 20 to 30 short Delta to cover the deficit. In this process, I made an mistake in selling less contracts, because I failed to consider my profit target was 50% of max potential. The proper formula for the new contract size should be the following:
Adjustment size = original size + 2 x (Deficit / new credit).

TBT started to bounce back immediately after my adjustment. After the 3rd and 4th day of the re-bounce, it became apparent to me that TBT was resuming its fall. So I sold more bear call spreads on the 5th day which TBT tried a weak pull-up. Luckily, the 50% profit target of the bear call spreads were reached in about 4 days. Thus, I closed it according to my rule. On the next day, I felt TBT dropping too low and too fast. I was able to find a lower put strike which was beyond my projected downward target. So, I sold some other bull put spreads (P3S & P3B). Since then, TBT started to pull up again. I followed it up closely and was trying to close the new bull put spread around 50% profit target. But I found this time, the re-bounce was more powerful especially the pull down on the 2nd day of the re-bounce was overcame on the 3rd day. Thus, I decided to let the profit accumulate. I may let it expire worthless if the market does not create a big ripple to shake me out. I plan to let the 1st bear call spread (C1Short/Bought) to expire as its short strike at $62 appears to be safe for me.

In retrospect, if I did not adjust around 8-15, my profit today would have been double that of the actual profit as shown in the bottom sub-graph. It also showed the P&L would have lager swing had I not adjust. This is a typical example of adjustment at the worse time. But I believe it's an uncertainty that we have to take. There are a couple of actions I could take that would make it better for the adjustment. First, I could have exited the P1S trade after 3 weeks when TBT kept testing lower side and did not show any sign of rises as the overall down trend was prevalent and persistent. Second, I should have sold more contracts when calculating the adjustment size. Overall, these trades were experimental and thus not consistent. I should be able to firm up my rules and apply them consistently in the coming weeks.

Saturday, August 9, 2014

A comparison chart of selling naked puts and spreads

I have been studying ways to sell options using a modified super trader Karen style for non-PM (portfolio margin) accounts (including IRA). To reduce risks, we have to sell spreads instead of naked options. Thus, it's very interesting for me to understand the differences of selling spreads or naked options. Today, I finally got some time to analyze the differences from the P&L behavior perspective. Other aspects (ROM, Bid/Ask slippages under high volatilities, easiness of execution, commissions, etc) of the differences will be studied later.

I selected a recent period that involved some market fluctuations as shown in the picture below. A 20% ITM probability put on SPY (2014May$175p) was used as the basis. The profit and loss of the following 3 option selling strategies were charted by a ThinkScript that I developed:

  • Short Naked put
  • Short put spread of $7 wide
  • Short put spread of $3 wide


As the width of the spread got narrower, the overall contract sizes were increased to maintain a similar level of maximum potential profit. The overall Delta of each strategical position was kept to a similar value around 200. As can be seen in the chart, all of the positions behaved similarly for these trades. They reached 50% profit target in a couple of weeks before dropping to negative territory, then bouncing back.

Due to the different contract sizes, the overall Greeks of the option positions were in similar ranges. Therefore, it's understandable that the P&L of these positions behaved similarly. If the number of contracts were kept the same for each position, then the spreads would have smaller Greeks values than those of the naked puts. In this case, I would expect the P&L curve of the spreads become less volatile than the naked put position, and it takes longer time for spreads to reach profit target. The narrower the spread, the slower its P&L moves. Additionally, the study focused on the 2nd month before expiration. If we chose a period that was closer to the expiration, I would expect larger behavior differences due to increased Gamma risk of the positions.

Issues in the TOS ThinkScript

I found there were many missing data points for extremely far OTM options, even though the ThinkBack showed valid data. I tried to analyze a put spread $159/$149 which had a 5% ITM probability for the short strike. But the corresponding P&L curve appeared to be erratic. After some investigation of the script, I realized that for far OTM options which traded less often (OI < 1,500) there were too many data holes to receive a proper chart. For this reason, I had to increase the ITM probability of the strikes used for this study. I plan to share the script with the Karen Study Group later.

Sunday, June 15, 2014

A study of Super trader Karen's trading process

I've been interested in studying the trading process and mindset of successful traders. Today, I reviewed what I learned from Karen's interviews from the trading process perspective.

Karen treats trading as a process and manages the process all the time. As far as I can see, her trading process involves the following elements as discussed in her interviews:
o   A suitable set of strategic trading rules,
o   An advanced trading software platform,
o   A successful trading mindset and psychology,
o   A daily trading routine,
o   A trading number game management,
o   An experienced trading team,
o   A Sufficient amount of time and money for trading and learning, and
o   Others.

Karen’s daily trading routine starts from market open hour till the end. The constant watch on the market by her trading team allows them to react to market changes promptly. Karen’s trading rules help them staying away from over-trading or over-adjusting. Her high degree of confidence on the high probability trades enables her of proper trade actions in the face of market uncertainty.

Karen treats trading as a number’s game so that she can play it objectively. She enjoys playing the big game all the time and taking the market challenges as well. There are no feelings wrapped around her trades or positions, as they are just numbers to her. The ability to turn emotions and perceived risks into a set of trading numbers and to focus on the numbers helps traders to decouple themselves from emotions and irrational trading actions. The emotion and fear are the biggest obstacles in trading and they take down most traders. The focus on trading numbers takes away the feeling of heart-ripping during adverse market conditions. As a result of the application of high probability trades by going far out of the money, a heavy percentage of Karen’s positions are winners.

Karen had discussed her learning and trading improvement process. She had more failures than successes in initial years. She was willing to invest in learning knowledge with a large amount of money and time that many other people may not be comfortable with. Her education fee at Investools alone cost over 20K USD. Small traders may have this limited amount in their trading accounts.

Karen established a tremendous trading team of about 6 members. 5 of them are experienced retail traders and 1 is an accountant. She encourages different ideas from team members. They usually will listen to each other, discuss the ideas and agree as a group. From time to time, they will test water with new ideas using a small amount of capital. If the new idea is proven to be working, then they don’t hesitate to apply it in full scale. The selling of weekly option was a good example of this process of adopting new ideas.

Some traders may get extremely disturbed if the temporary position loss becomes very big. Karen does not get emotional about any of her positions. When positions are in danger, she will do whatever it takes to fix them and make them back to the original profit at the expiration date as described in Section 6 Trade Adjustment Rules. She is not bound by the future direction of market moves, but always reacts to it if the ITM probability and profit percentage of her positions indicate to her for adjustments.

Karen suggested traders to look at the profit and loss numbers of the portfolio but not to focus on the P&L. This is reflected on her trading team structure as well as there is only one accountant (vs 5 to 6 traders). With this team, the traders should be able to focus more on the other important trading numbers. Personally, I think the key numbers Karen discussed in the interviews can be summarized as the following:
·         ITM probability
o   First factor used to determine if opening, closing or adjustment is required
·         Prices and trend of the underlying
o   Second factor used to determine if adjustment is required
·         Stress-tested market crash losses vs net liquidation value
o   Critical number that indicate how many contracts to sell
·         Option premium changes and time to expiration
o   Available options for adjustments


Karen stated she is willing to take losses when necessary and she will keep existing profit in her positions also. However, there were no examples discussing when to give up positions for losses (probably after the portfolio margin runs out). It’s worthwhile noting that Karen did not indicate any rules based on position losses. She did not mention any direct trade reaction to the amount of loss of a position. Her trade adjustment rules are based on ITM probability and the current market trends.

Saturday, June 7, 2014

Which index option provides better premium return per volatility?

Major indices have their own volatilities over the last 5 years as shown in the chart below. The volatility $RVX of RUT is consistently higher than those ($VXN and $VIX) of NDX and SPX. For example, RUT had a 59% higher volatility than SPX on June 6 of 2014. This difference was on the high side. On March 1 of 2010, RUT volatility was 17% ((20.43-17.42)/17.42) higher than that of SPX which was a normal difference. The volatility of NDX is only slightly higher than that of the SPX most of times.

Karen stated she prefer to trade SPX over NDX and RUT. She had a good year (probably 2009) trading RUT with relatively higher return. But she likes the lower risks trading SPX. She does not want to trade NDX which has higher risk with similar return rate.
How do we know we are getting a good return for the risk of a trade using each vehicle of different volatility? I made a simple attempt to investigate the covered return per implied volatility of each trade and showed the results in the top right corner of the above chart. Basically, the covered return for each call and put option on 6-7-2014 were obtained from the TOS analyzer. The options had 41 days to their July expiration date. The calls had around 10% ITM probability and the puts had around 5% ITM probability. The implied volatility of each individual option was obtained from the TOS analyzer as well. I assume the ratio of covered return over IV would give us a fair measurement of return for the IV of each trade.

As can be seen in the table embedded in the above chart, selling puts of SPY, IWM, and QQQ would have similar returns (about 6%) on this date. Given SPY is less volatile, SPY put would be a good choice. For the short calls with 41 DTE, SPY does have lower returns (12.8%) than IWM (14.5%) and QQQ (14.6%). Please be advised that this study includes one set of data from one day only. It may not be generalized for other days. Further study is required to understand it more deeply.

Sunday, May 25, 2014

Investigating stress tested portfolio margin for Karen style positions

Thanks to the help from Tom of the Karen Study Group, I was able to set up my TOS paper account to portfolio margin and came up with the following initial understanding.

Karen uses a unique method to manage the allocated trading capital. She pretends the market dropping over 12% in her margin crash tests while TOS portfolio policy stated a minimal 10% drop for portfolio margin using broad index based vehicles. Using the TOS analyzer, she watches potential crash loss in the portfolio against the net liquidation value of her account as shown in the following picture. On the Analyzer tab, the daily P&L numbers at 10% up and 12% down must not exceed net liquidation value. 
In the above chart, the +6% and the -10% slices are broker SPX stress test prices. All the other slices beyond them are Karen’s stress test points. In order to maintain sufficient adjustment capital during market sell-offs, Karen lowers her stress test point below the 10% down point by another 100 to 200 offset points, depending on the long term market volatility condition.
  • · 2013 Crash price (cushion) = (Current price – 100) x 88% due to lower volatility.
  • · 2011 crash price = (current price – 200) x 88% due to higher volatility.


According to Figure 2: SPY and Its Implied Volatility Since 2008 shown before, there are 2 levels of IV in the past few years. Starting at January of 2013, the volatility made a lower low and stayed within a much narrow and lower channel ever since. Thus, it makes sense to use the smaller and pretended drop of 100 points of SPX in the crash price calculation starting at the beginning of 2013.

In my personal opinion, it will be a good time to switch to the larger drop of 200 points of SPX when the IV makes a higher low and forms a newly elevated channel in the future. If the volatility VIX is generally lower to a level of 11 and 12 at its bottom (this is a long bull market condition), the 100-point offset is used. If the volatility is higher to a level of 13 at the bottom of the VIX, the 200-point offset is used.
Additionally, it is easier in the TOS analyzer and more conservative if a Karen style trader uses the following formula to determine the crash price. Karen does not offer complete details of her trading system but encourages traders to come up with the system that they are comfortable with.

  • ·         crash price = current price x 88% - 100 or 200

According to the statements in the interview, the 12% crash down price has a probability of ITM of 5% approximately. Let’s investigate it using today’s data as a specific example. The SPX price is 1900 on May 25, 2014. The 12% down SPX price based on Karen’s stress test formula is 1584. There is a 53 DTE July 1585 put option of ITM probability of 2%. Although the probability to expire ITM on July expiration date is quite low, the probability to touch the strike of 1585 is a bit higher, probably twice the amount of expiration probability to 4 to 10%.
Now, we can study the margin requirement and its changes for the hypothetical position shown in the above chart. It’s clear that the opening or initial margin requirement is $6,291. The “Explain Margin” section embedded in the chart indicates the margin requirement changes from -10% to +6% of SPX price changes.
However, if SPX drops to 1565, a level looked by Karen style trader, the loss would be $19,968. Karen would make sure the loss number is less than the net liquidation value of the account on the opening day with the proper size of contracts. This amount of the loss would be higher than the initial margin requirement of $6,291. As of today, I’m not sure what would the new margin requirement be in this scenario. Would it become 4.9 times of the initial margin requirement to $30,869? How margin requirement changes in market crash conditions still needs investigation in the future.
Although the PM requirement changes according to market conditions for existing portfolio and the changes may be different for various brokerage firms, the net liquidation value of an short option account is more deterministic. Therefore, the net liquidation value is used as the basis for comparing the daily P&L number in Karen style trading.

It should be noted that the initial margin $6,291 of the position is dictated by the short call option at an upside movement of +6% of SPX price as the down side movement of -10% requires a less amount of margin of $6,266 only. It implies more puts can be sold in trade adjustments if market tanks, because short put options require significant less margins. This is naturally helpful to obtain more credits to cover the deficit of put option rolling down or out when market crashes.


Sunday, May 4, 2014

Continued analysis of Karen style short put trades during flash crash

After the last post on flash crash study, I tried to create a couple of simulated trades for the flash crash option cycle using Super trader Karen's style and to test possible adjustments on the big down days (May 6 & 7 of 2010). The results were a bit surprising as the simulated positions did not pass the 30% ITM probability too much according to end-of-day data from TOS. The following is the details of my analysis of the simulated trades.

Karen discussed the flash crash day as a great day of option trading for her style. She mentioned she had to give up profits for a few months to get into a safe territory. Before the crash date, a portfolio of Karen style would have naked options of the May (14 DTE) and June (42 DTE) cycles most likely. The May options might be started more than 40 days ago in the last two weeks of March following the 56 day rule to open trades. The June options might be started over 14 days ago in the last 2 weeks of April. 

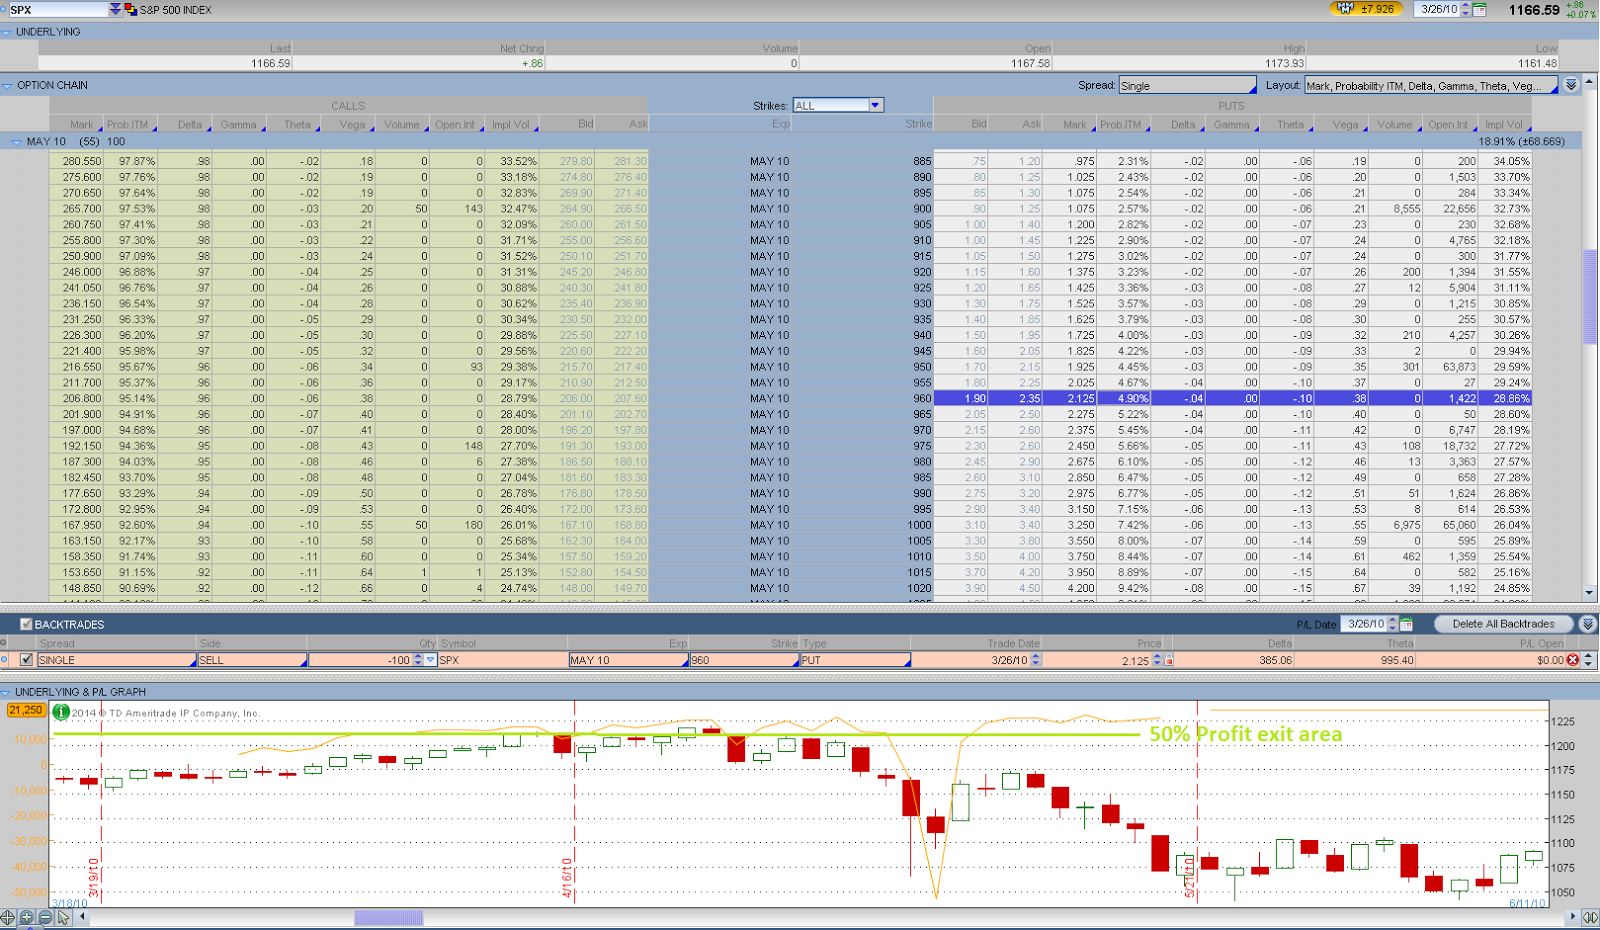
Let’s take a look at the life of the May put options first. As marked in the above chart, March 25 was the 56 DTE. On the next market down day on March 26, we could sell SPX May $960 put which had ITM probability of 4.90% for $2.13. However it was a bit surprising that the actual trading volume for the strike was minimal. It looked like Karen did not trade on that day. The option reached 50% profit zone in one week or two. If we took profit following the rules in Section 5 Exit Rules and Winner Management, then everything else would be simple for this position. Otherwise, it would be a rough ride. On May 7 with 14 days to expiration, the put option price was $7.4 with ITM probability of 13.2%, about 3.5 times of the originally sold price. With Karen’s winner management rules, the option would be let expire worthless for a maximum profit since it might not reached the adjustment point. Overall, the May put options did not appear to be in real danger when compared against June put options at the flash crash according to this analysis.


Now, let’s study the life of the June put options. There were 56 days to expiration for June options on April 22, 2010. This day and the next day were up days for market as shown in Figure 11: SPX Daily Chart of Flash Crash of May 6, 2010. So we could sell calls in these two days.
On April 27, 2010 the market dropped significantly and it was a good time to sell puts. We could sell 100 contracts of June $935 put with a 4.88% ITM probability (Delta = 4) following Karen’s entry rules described in Section 3 Option Selection and Section 4.1 Entry (Legged in) Rules. The bid/ask prices were $2.00/$2.90 (middle price = $2.45) and the volume was over 500. 
Additionally, if the some puts were sold some time before the close of market, the trade could have seen June $950 strike having ITM probability at 5% (5.68% EOD) and sold these contracts for a premium around $2.45. The end-of-day price became $2.90 for the strike which indicated a $0.45 loss on the day. By the way, the actual volume of this specific put strike on the day was about 1.7K, the 2nd largest quantity for OTM strikes of the day.

According to Figure 12: The Life of a 5% ITM Probability Put Option Survived the Flash Crash, the June $950 put option’s ITM probability would have approached 30% at the lowest point of the flash crash day.  But it was unlikely that it exceeded the 30% ITM probability too much, even if the position losses could be 7 times of the original premium received. If the Karen trader stayed calm, did not get scared by the big account loss at the moment and followed the adjustment rules, there would be no need to adjust this position.


However, most retail traders are likely to get close to panic in the market crash environment, because they would find a huge loss number at the profit and loss field of the portfolio and figure out that the loss on paper would take many months to a year to recover. They may start to forget about rules and disciplines and execute special trades that would ruin the portfolio later on. Karen gave some help on how to deal with such psychological issues as discussed in Section 8 Psychology and Mindset.