Pages

Thursday, June 1, 2017

Taking Profit out of Diagonal Call Spread to Increase Leverage and Time to Expiry

Stock options are a leveraged trading vehicle for traders. There is a specific term that measures the level of the leverage. It is called Omega. Omega measures the relative percentage changes between the stock and the option, and is used as an elasticity measure for the option.  The formula to calculate Omega is given below.

Omega = Option Delta * (stock price / option price).

As the stock price rises, the value of the long call option increases. The Delta of the long call also increases up to a maximum value of 1 eventually. Once the Delta approaches 1, the most significant contributor to the option leverage level is the option price as it changes in larger percentages than the stock price, according to the above formula. Therefore, the leverage of a call option decreases as its stock prices rise to deep in-the-money (ITM). 

In a similar principle, the option leverage decreases for diagonal call spreads when the stock prices go further deep ITM while the short call strike remains out-of-the-money (OTM).  This is exactly what happened to my QQQ Diagonal Call Spread.

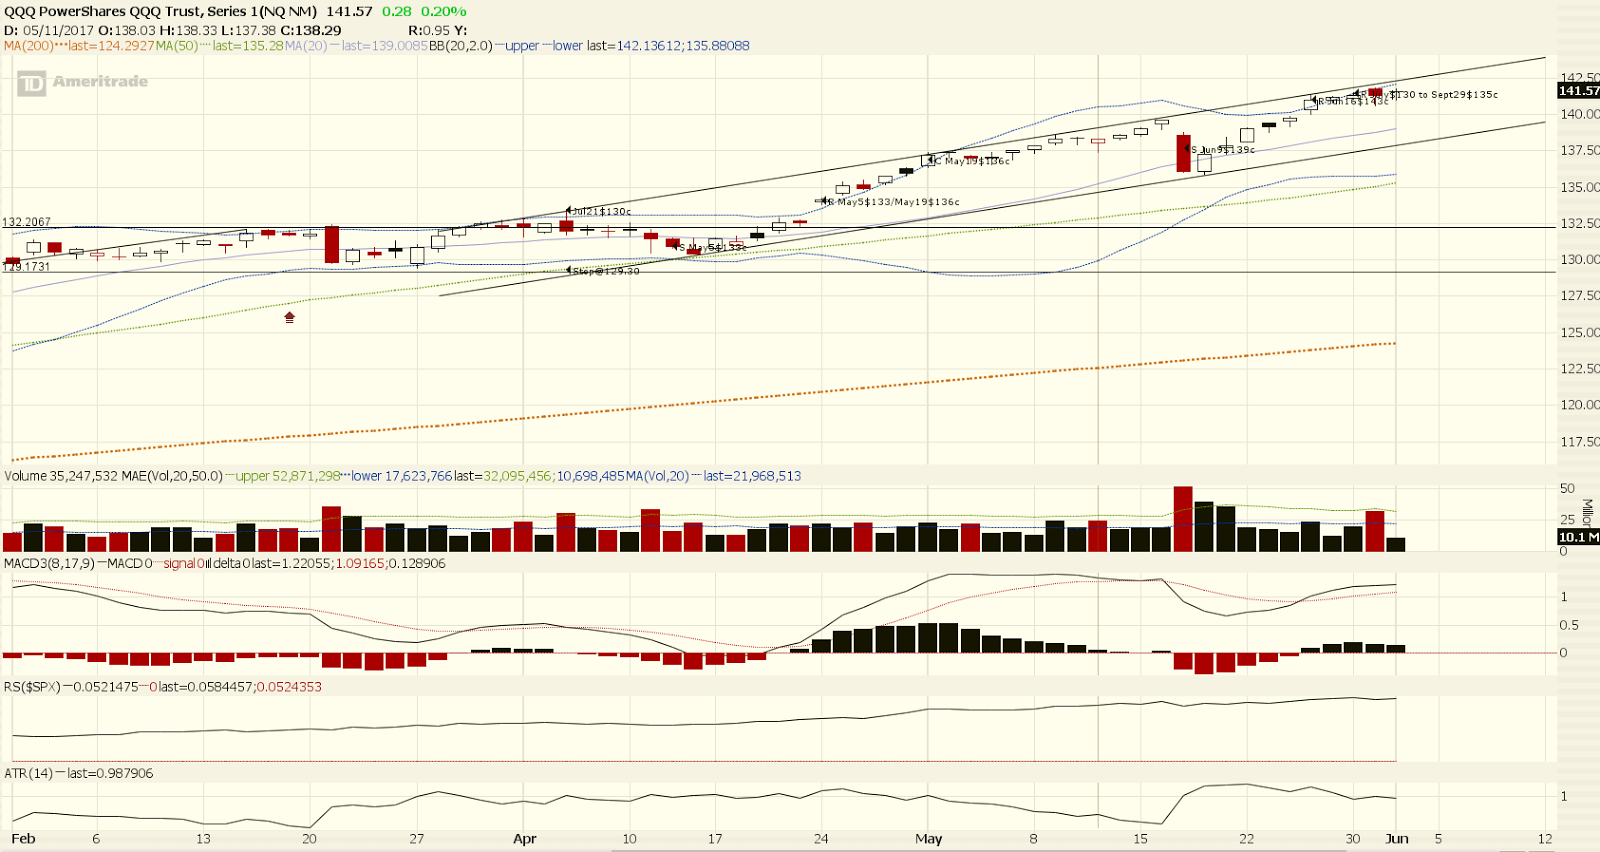
To keep sufficient option leverage, I rolled out the long call from July to September and reduced the Delta of the long call from 0.9 to approximately 0.65, which is my initial long Delta at the entry of my diagonal call spreads.  On Tuesday May 30th, I sold the original long call and bought a new call for a credit of $2.82.

The rolling adjustment to the diagonal call spread allowed me to take a profit of $2.82 and extend the life of my diagonal spread by more than 2 months. I can use the extended time to sell call options a few more times and receive additional premiums when needed to compensate for the option time decay.

The adjusted diagonal call spread also reduced its position Delta from 0.6 to 0.4. This was desirable for a stock that had risen consecutively in the last 7 days and I expected a pull-back soon. The pullback would cause less profit drops as the Delta was reduced. In the meantime, if the stock price continued to climb, the profit increase would be less as well. This scenario could be changed with the uncovering (buying back) of the short call though.

The QQQ diagonal entry and rolling history up to now is shown in the table and marked in the stock chart below.
Date
Spread
Side
Exp
Strike
Price
Net Price
Pos Effect
Total Cost
4/5/2017
SINGLE
BUY
21-Jul-17
130
5.86
5.86
TO OPEN
5.86
4/12/2017
SINGLE
SELL
5-May-17
133
0.8
0.8
TO OPEN
5.06
4/24/2017
DIAGONAL
SELL
19-May-17
136
0.58
-1.14
TO OPEN
4.48


BUY
5-May-17
133
1.72
DEBIT
TO CLOSE
6.2
5/1/2017
SINGLE
BUY
19-May-17
136
1.86
1.86
TO CLOSE
8.06
5/17/2017
SINGLE
SELL
9-Jun-17
139
0.85
0.85
TO OPEN
7.21
5/25/2017
DIAGONAL
SELL
16-Jun-17
143
0.57
-2.05
TO OPEN
6.64


BUY
9-Jun-17
139
2.62
DEBIT
TO CLOSE
9.26
5/30/2017
DIAGONAL
BUY
29-Sep-17
135
8.86
-2.91
TO OPEN
18.12


SELL
21-Jul-17
130
11.77
CREDIT
TO CLOSE
6.35

In summary, the leverage of options is related to the strike price compared with the stock price:
  • Deep ITM options have less leverage than ATM & OTM options
  • ATM options have less leverage than OTM options and more leverage than ITM options
  • OTM options have more leverage than ATM & OTM options

Increasing leverage usually means taking more risks for stock investments. However, this is not necessary true with the rolling diagonal spread trading strategy, as described in the example of this post. The main reasons are outlined below.
  1. The rolling of the long option takes some profit out and leave less money on the table.
  2. The rolling of the long option gives the position more time for selling additional premiums.
  3. The rolling of the long option reduces overall position Delta and makes it less susceptible for stock price drops and smoother for profit gains.


The catch is that the new position will profit less before the long Delta approaches 1 again. This scenario happens with less probability though.

Friday, May 26, 2017

Adjustments of Diagonal Spreads to Meet New Market Outlook

Yesterday, the stock market delivered the 6th consecutive rises, accompanied by higher volume. It also broke prior high to signal the resumption of the powerful uptrend.

Both QQQ & SPY showed their 2 month long uptrend channel lines, after a confirmation by rallying from the lower channel line 6 days ago. If the momentum is strong, I think the market indices will grind higher along the upper trending channel line as shown below, with some minor pullbacks along the way.

After hedging positions with short calls on the scare of presidential impeachmentsell-off 7 trading days ago as described in a previous post, the stock market started rising gradually, with declining volume for 5 days.  Therefore, I did not uncover the short calls until the market’s rise with higher volume yesterday.

Typically, market would pullback after 8 days for consecutive rises. On the 6th day of the continuous rise, I decided to roll up and out the short calls for most of my diagonal call spread positions expiring from June 9 to June 16. The new short call options have 22 days to expiration and Delta around 0.25 as usual.

Due to the large price hikes, the diagonal spread positions were on the border of Delta inversion before the rolling. It meant overall diagonal position could not profit even though there were good amount of price increases at the inversion day. 

The new positions are summarized below for reference.
Stocks
Existing Calls
New Short Calls
Notes
Jun9 $162.5; $1.63
Bought back for $4.20
Left naked call Sept15 $145 as it broke out $161 resistance with high volume
Jun9 $42; $0.27

No change as it approached resistance level 41.7 without stronger relative strength
Jun9 $30.5; $0.34

No change as it approached resistance level $29.5
Jun9 $239.5; $1.22
Jun16 $244.5; Rolling deficit of $2.43
Used short call with the expectation of a pullback after a 6 day rise in a roll
Jun9 $139; $0.83
Jun16 $143; Rolling deficit of $2.04
Used short call with the expectation of a pullback after a 6 day rise in a roll


The trading plan is to uncover the diagonal spread if the market tries to pull back and rally from there again. If market continues to grind up, I’ll continue to roll up and out for the diagonal spread.

Sunday, May 21, 2017

Simple Hedging Strategies for Market under Pressure

On Wednesday of last week, we saw market stumbled with huge volume due to fears about possible presidential impeachment. It created technical damages to the SPX chart as shown below, even after a subsequent 2 day rally.
  1. SPX price went back to $2400 ~ $2330 range
  2. SPX 50 day moving average seemed to move sideways
  3. 4 distribution days accounted in the last few weeks
  4. Momentum indicator MACD turned
  5. Cyclical indicator Stochastics turned below 80

If SPX falls below 2352 in the next few days and register more distribution days, it would require more hedging actions. The simple strategy to use is to sell and/or roll down short call options and minimize weak positions to reduce portfolio risks. Since I have short calls already sold last Wed., I’ll roll down some of the call options in such an event.

In the meantime, if the accumulative new highs – new lows index of NASDAQ & NYSE also shows a top, I would consider the market outlook as going to correction for a couple of months at least. I would continue to reduce positions, as I had already sold the weakest performer (PVH) in my portfolio.

In general, the accumulative new highs – new lows indicators of stock market on NASDAQ and NYSE exchange are effective indicators to signal intermediate and long term market tops.  They usually do not turn down in short term pullbacks.  Therefore, they can be used as a type of filter to market fluctuation noises in the short or near terms to help intermediate and long term traders to maintain bullish positions. If there is at least one of these indicators (on ether NASDAQ or NYSE) trending up, then the market is likely not to go to a correction phase yet. However, this type of indicators may lag other indicators where rapid sell-off occurs during market tops, particularly in climax selloffs.

There is also a possibility that the market will continue to rise. I’ll be convinced of the resumption of the market up-trend if SPX tries to fall then recover to show a bullish candlestick pattern along with improving indicators in the SPX chart. If market grinds higher, I may roll up my short call option strikes to allow me to gain mild profits.

Wednesday, May 17, 2017

Hedging Bullish Positions to Reduce Portfolio Risks as Market Plunges

The stock market sold off today after $SPX could not break above the 2400 level in the last 2.5 months while $VIX dropped to historical low level for a couple of weeks. In about half a day, SPX erased all the gains after the French electionresult day as describe in my post and fell below 50 day moving average with huge volume.

While the headline news was political concerns about US president, the technical analysis of the market trend did signal a major weakness of the market. All of the stocks discussed in my blog expressed signs of weakness as well.

So, I hedged all long positions with short calls at Wall Street noon time with the exception of EPI which does not have sufficient option liquidity. The short calls had Delta from 0.28 to 0.35, with In-The-Money expiration probability around 30%.

Here’s the list of short calls for the recent long stock call options.

Stock
Short Calls
Prices
Notes
NFLX
June 9 $162.5
$1.63

EEM
June 9 $42
$0.27

PVH
September 15 $95
$8.60
Closed position
MU
June 9 $30.5
$0.34
Sold 2 days ago

At the time when I was trading, PVH was trading below its 50 day moving average but above my stop loss point $97.79 (as described in my post Trading chart pattern from a bull flag turning to a high base with diagonal spread) after bouncing back from below it. Since it was the weakest stock in my portfolio, I just sold the September 15 $95 Call to close the position for $8.60 (close to middle price) which got filled immediately. As with other stocks, it resumed plunging after Wall Street’s lunch time and it broke below my stop loss point by the end of the day.

For MU which entered into a diagonal spread a couple of days ago, I did not roll down the short call on MU since the option price did not reach 1/3rd of the initial premium at the time.

Another better hot stock NFLX had a good advance, but seemed to pull back in the last few days. It fell 2% when I sold its June 09 call at strike $162.5.
Overall, it was a busy day for me as a part time trader, since it took me about 1 hour to complete all the trades. I also hedged my longer term bullish positions on SPY & QQQ call options with short calls. These positions were entered before the initial French Election result on April 24 and were not posted in the blog. I plan to provide some summary in the future about these longer term trades.