Pages

Sunday, May 25, 2014

Investigating stress tested portfolio margin for Karen style positions

Thanks to the help from Tom of the Karen Study Group, I was able to set up my TOS paper account to portfolio margin and came up with the following initial understanding.

Karen uses a unique method to manage the allocated trading capital. She pretends the market dropping over 12% in her margin crash tests while TOS portfolio policy stated a minimal 10% drop for portfolio margin using broad index based vehicles. Using the TOS analyzer, she watches potential 
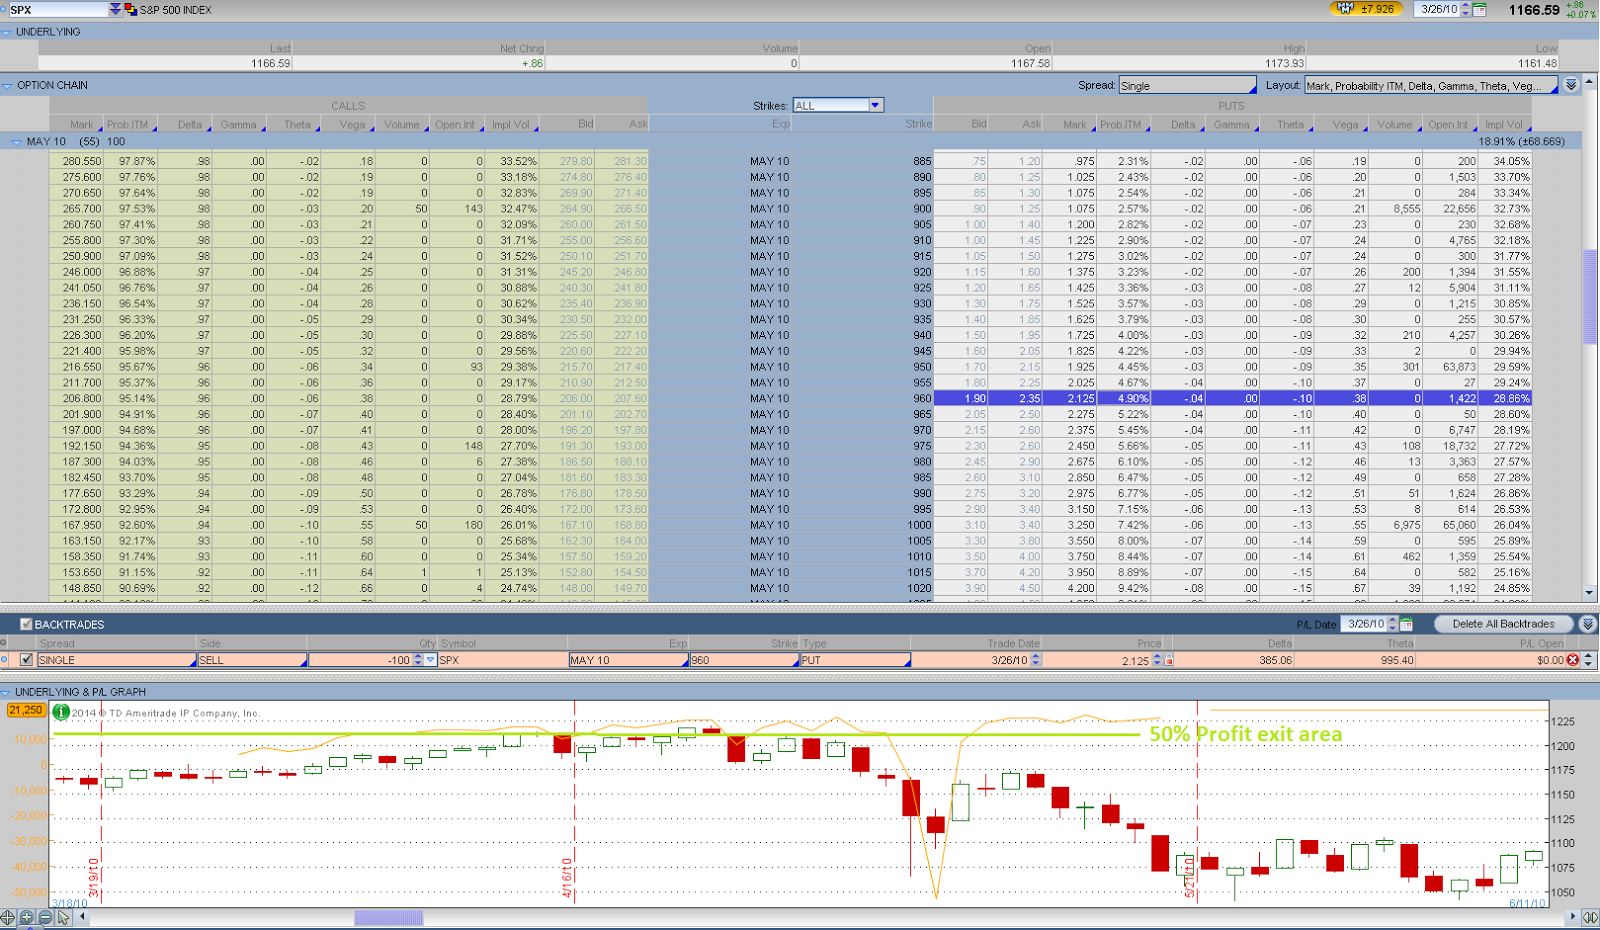
crash loss in the portfolio against the net liquidation value of her account as shown in the following picture. On the Analyzer tab, the daily P&L numbers at 10% up and 12% down must not exceed net liquidation value. 
In the above chart, the +6% and the -10% slices are broker SPX stress test prices. All the other slices beyond them are Karen’s stress test points. In order to maintain sufficient adjustment capital during market sell-offs, Karen lowers her stress test point below the 10% down point by another 100 to 200 offset points, depending on the long term market volatility condition.
  • · 2013 Crash price (cushion) = (Current price – 100) x 88% due to lower volatility.
  • · 2011 crash price = (current price – 200) x 88% due to higher volatility.


According to Figure 2: SPY and Its Implied Volatility Since 2008 shown before, there are 2 levels of IV in the past few years. Starting at January of 2013, the volatility made a lower low and stayed within a much narrow and lower channel ever since. Thus, it makes sense to use the smaller and pretended drop of 100 points of SPX in the crash price calculation starting at the beginning of 2013.

In my personal opinion, it will be a good time to switch to the larger drop of 200 points of SPX when the IV makes a higher low and forms a newly elevated channel in the future. If the volatility VIX is generally lower to a level of 11 and 12 at its bottom (this is a long bull market condition), the 100-point offset is used. If the volatility is higher to a level of 13 at the bottom of the VIX, the 200-point offset is used.
Additionally, it is easier in the TOS analyzer and more conservative if a Karen style trader uses the following formula to determine the crash price. Karen does not offer complete details of her trading system but encourages traders to come up with the system that they are comfortable with.

  • ·         crash price = current price x 88% - 100 or 200

According to the statements in the interview, the 12% crash down price has a probability of ITM of 5% approximately. Let’s investigate it using today’s data as a specific example. The SPX price is 1900 on May 25, 2014. The 12% down SPX price based on Karen’s stress test formula is 1584. There is a 53 DTE July 1585 put option of ITM probability of 2%. Although the probability to expire ITM on July expiration date is quite low, the probability to touch the strike of 1585 is a bit higher, probably twice the amount of expiration probability to 4 to 10%.
Now, we can study the margin requirement and its changes for the hypothetical position shown in the above chart. It’s clear that the opening or initial margin requirement is $6,291. The “Explain Margin” section embedded in the chart indicates the margin requirement changes from -10% to +6% of SPX price changes.
However, if SPX drops to 1565, a level looked by Karen style trader, the loss would be $19,968. Karen would make sure the loss number is less than the net liquidation value of the account on the opening day with the proper size of contracts. This amount of the loss would be higher than the initial margin requirement of $6,291. As of today, I’m not sure what would the new margin requirement be in this scenario. Would it become 4.9 times of the initial margin requirement to $30,869? How margin requirement changes in market crash conditions still needs investigation in the future.
Although the PM requirement changes according to market conditions for existing portfolio and the changes may be different for various brokerage firms, the net liquidation value of an short option account is more deterministic. Therefore, the net liquidation value is used as the basis for comparing the daily P&L number in Karen style trading.

It should be noted that the initial margin $6,291 of the position is dictated by the short call option at an upside movement of +6% of SPX price as the down side movement of -10% requires a less amount of margin of $6,266 only. It implies more puts can be sold in trade adjustments if market tanks, because short put options require significant less margins. This is naturally helpful to obtain more credits to cover the deficit of put option rolling down or out when market crashes.


Sunday, May 4, 2014

Continued analysis of Karen style short put trades during flash crash

After the last post on flash crash study, I tried to create a couple of simulated trades for the flash crash option cycle using Super trader Karen's style and to test possible adjustments on the big down days (May 6 & 7 of 2010). The results were a bit surprising as the simulated positions did not pass the 30% ITM probability too much according to end-of-day data from TOS. The following is the details of my analysis of the simulated trades.

Karen discussed the flash crash day as a great day of option trading for her style. She mentioned she had to give up profits for a few months to get into a safe territory. Before the crash date, a portfolio of Karen style would have naked options of the May (14 DTE) and June (42 DTE) cycles most likely. The May options might be started more than 40 days ago in the last two weeks of March following the 56 day rule to open trades. The June options might be started over 14 days ago in the last 2 weeks of April. 

Let’s take a look at the life of the May put options first. As marked in the above chart, March 25 was the 56 DTE. On the next market down day on March 26, we could sell SPX May $960 put which had ITM probability of 4.90% for $2.13. However it was a bit surprising that the actual trading volume for the strike was minimal. It looked like Karen did not trade on that day. The option reached 50% profit zone in one week or two. If we took profit following the rules in Section 5 Exit Rules and Winner Management, then everything else would be simple for this position. Otherwise, it would be a rough ride. On May 7 with 14 days to expiration, the put option price was $7.4 with ITM probability of 13.2%, about 3.5 times of the originally sold price. With Karen’s winner management rules, the option would be let expire worthless for a maximum profit since it might not reached the adjustment point. Overall, the May put options did not appear to be in real danger when compared against June put options at the flash crash according to this analysis.


Now, let’s study the life of the June put options. There were 56 days to expiration for June options on April 22, 2010. This day and the next day were up days for market as shown in Figure 11: SPX Daily Chart of Flash Crash of May 6, 2010. So we could sell calls in these two days.
On April 27, 2010 the market dropped significantly and it was a good time to sell puts. We could sell 100 contracts of June $935 put with a 4.88% ITM probability (Delta = 4) following Karen’s entry rules described in Section 3 Option Selection and Section 4.1 Entry (Legged in) Rules. The bid/ask prices were $2.00/$2.90 (middle price = $2.45) and the volume was over 500. 
Additionally, if the some puts were sold some time before the close of market, the trade could have seen June $950 strike having ITM probability at 5% (5.68% EOD) and sold these contracts for a premium around $2.45. The end-of-day price became $2.90 for the strike which indicated a $0.45 loss on the day. By the way, the actual volume of this specific put strike on the day was about 1.7K, the 2nd largest quantity for OTM strikes of the day.

According to Figure 12: The Life of a 5% ITM Probability Put Option Survived the Flash Crash, the June $950 put option’s ITM probability would have approached 30% at the lowest point of the flash crash day.  But it was unlikely that it exceeded the 30% ITM probability too much, even if the position losses could be 7 times of the original premium received. If the Karen trader stayed calm, did not get scared by the big account loss at the moment and followed the adjustment rules, there would be no need to adjust this position.


However, most retail traders are likely to get close to panic in the market crash environment, because they would find a huge loss number at the profit and loss field of the portfolio and figure out that the loss on paper would take many months to a year to recover. They may start to forget about rules and disciplines and execute special trades that would ruin the portfolio later on. Karen gave some help on how to deal with such psychological issues as discussed in Section 8 Psychology and Mindset.