Pages

Showing posts with label butterfly. Show all posts

Sunday, January 13, 2013

4th Quarter Adjustment Trade Review for High Probability Portfolio

As part of the trading process, I need to review past trades regularly to improve future performance. Today, I analyzed the past trade adjustments from an option adjustment strategy and SPX price level perspective using the following color coded graph.
The green box indicates the starting portfolio until 1st adjustment for each month. Other colored box represents strategies such as (multiple) calendars, IC (iron condor), vertical spread, butterfly, ETF trades. The blue oval indicates position exits.

It looks like the October portfolio was the lucky one offered by the market which ended at the same level as the start by SPX price. The double calendar adjustment worked perfectly for the month.

For November portfolio, it looks like the IC rolling up adjustment on 10-17 belongs to over-adjustment and the IC roll should have been risen to the point where the deficit was reset by the profit from closing of the put spread. If one of the above errors was not there, the portfolio would have ended much better. I think I was tricked by the stronger volume advances of the market for a couple of days at the time of the IC roll, even though the market did not reach confirmed uptrend state yet. I somehow mishandled the IC rolling rules at that moment.

For December portfolio, there were quite a number of adjustments (may be over-adjustments?). The 1st calendar adjustment on 11-15 started when portfolio Delta was 22 only and this adjustment was one sided calendar (Usually multiple calendars are required to maintain smoother P&L curve). The butterfly adjustments, including the one on 12-04, and the unbalanced butterfly on 11-29 seemed to offer little changes to the Delta.

Although it was a profitable quarter, I still need to sharpen my rules on adjustment points and the associated strategies.

Sunday, January 6, 2013

Analysis of Jan Paper Portfolio Option Trades

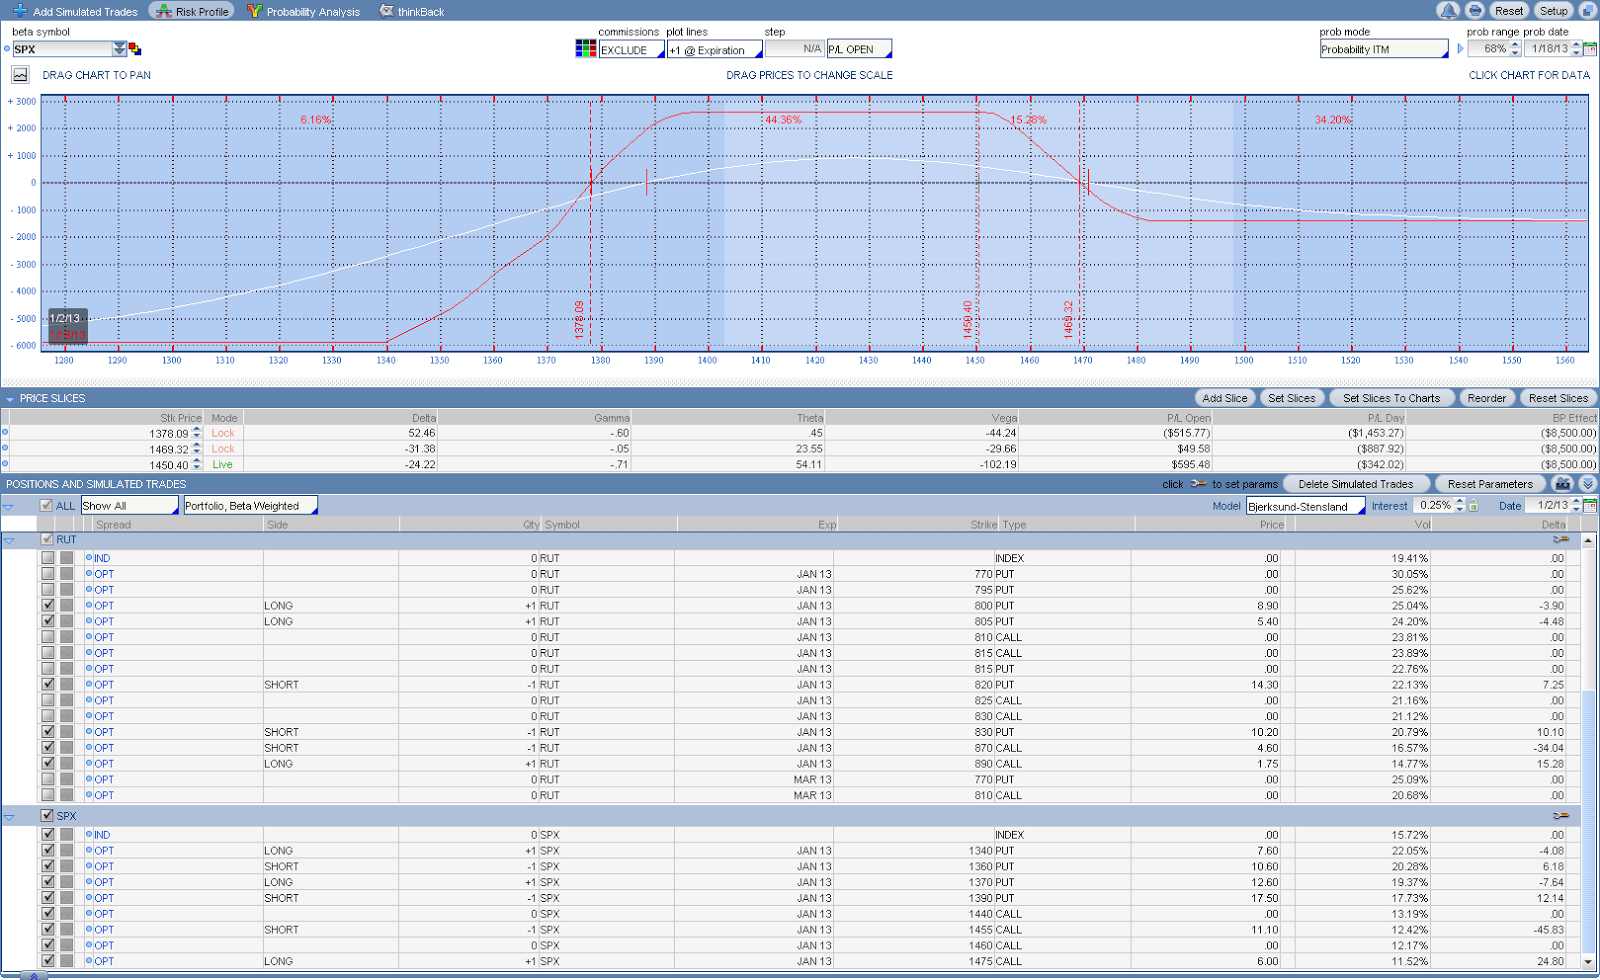
On Jan 2 which was the first trading day of 2013, market responded to the news of resolution of the fiscal cliff. The Jan market neutral paper portfolio got hammered. Its delta reached -78 as shown below.

With about 13 days to expiration, I decided to start exiting positions. So I closed most positions that had little or negative Theta, leaving the positions that had good Theta untouched.


The portfolio had gone through 5 adjustments since its completion around 11-20 as shown in the image below. There were 2 times that SPX rose 30 points that caused adjustments.

There was a major mistake in the first adjustment with butterfly spread on 12-1, due to its lack of delta. Regular Butterfly adjustments, although very cheap, are suitable for late adjustment only since their P&L change mostly in the last 7 days. Note unbalanced butterflies, which cost more, are good for late adjustments in up-trending markets as well, even if their values start to change earlier (2 weeks to expiration) than that of the regular butterflies as analyzed before.

This adjustment error was partially caused by the unbalanced butterfly adjustment to my real portfolio which occurred one day before and made me addicted to butterflies rather than other proper strategies.

If I had adjustments that had reduced enough Delta around 11-30 and kept enough profit potential, then it would be most likely to close the portfolio around 12-27 when market pulled significantly.

Thursday, December 20, 2012

Closed December RUT butterfly

Yesterday, I finally closed the RUT butterfly to exit all December positions with 2 days left for expiration. In the last week of the butterfly, I observed it to receive a 15% of max potential profit while RUT price was very close to the short strike of $835. It did not reach my target of 20% though. After a couple days of wiggling by the RUT, I had to sell this spread for a minor loss. The sell order which was 5 cents below mid price was executed immediately.

This trade reinforced my understanding of butterfly spreads. A normal butterfly would start to gain value in the last 7 days if market moves in the desired direction. A unbalanced butterfly would start to gain in about 2 weeks to expiration.

Unbalanced Butterfly spreads are good adjustment vehicles in bull market only if the portfolio expiration date is close to 2 to 3 weeks and one intend to hold the option positions close (10 to 5 days) to expiration. If there are more than 3 weeks, unbalanced butterfly spreads may not be good adjustment strategy, depending on its Delta and Theta mainly. If the adjustment trade brings little delta and theta, it's usually a bad adjustment since it does not impact the portfolio much at the adjustment time. For this reason, a normal butterfly is not good adjustment for the smooth option portfolio that I trade. In non-bull market, the unbalanced butterfly may not be good adjustment strategy due to its negative Vega.

Tuesday, December 11, 2012

December Income Option Inventory Closing Down

Yesterday, RUT was marching higher and caused my portfolio delta moving further than -40. With Gamma over 2.5,  I decided to exit the monthly income positions to take what ever market gave me at the moment and avoid additional risks. I forgot to take a snapshot before closing down positions and realized that after a few trades. So the chart below does not have the correct P&L figures but it records the Greeks for my future analysis.
Eventually, I closed all positions except a RUT butterfly shown below. The profit target is 20 to 30% of MAX. I may close it if the probability changes from 20% to 10% or so.


Tuesday, December 4, 2012

Another adjustment with butterfly to pump up profit curve

As market turned up at the intermediate term, my option premium selling portfolio for December has been dealing with rising delta. Yesterday as time was gradually get closer to expiration, I found it's helpful to create a regular butterfly spread which increased theta and reduced delta for the smooth portfolio. The main effect appeared to be pumping up the right slope of the P&L chart from 1430 to 1440 area as shown in the image below. When the 2 to 3 day pullback is done, I might have to purchase 100 or 200 SPY to neutralize portfolio delta by 10 to 20 points, weighted on the SPX index. It should keep my theta around 100 for a few more days so that I can close the December portfolio about 2 weeks before expiration.

Saturday, December 1, 2012

Responded to Bull Attack at the High Probability Portfolio with Butterfly

On last Thursday, the 2 month out paper portfolio experienced a bull attack on the up side when the bulls reached the east boundary of the portfolio break-even points. The weaker RUT position suffered a small temporary blow as shown in the P&L chart below. Note the delta reached -52 with about 8 weeks to expiration. If the portfolio were built with shorter term options, it would cause lot more damages.
In response, I brought up a small, additional reserve capital to help fight the bulls by moving my eastern frontier further out, through a launch of a 2 month butterfly. The butterfly provides some longer term protection to my expiration territory and has little values of Greeks for the near term. The new battle map below indicates an approximate 10 point advance by my soldiers to the east boundary, with limited changes to the Greek values.
The portfolio is definitely stressed at the moment, as indicated by the Greeks. But my soldiers are still in good formation and they have plentiful of time waiting for the probabilistic market to assert himself. Of course, the portfolio is given a risk tolerance of $1,500 should SPX shots up $30 more points relentlessly to 1445 level, since high probability does not provide any guarantee for this specific trade. This is understood as the mind set of successful traders.

Note: There was cancellation trade for RUT Jan$830c. It resulted margin increase of $2000 and the new profit in the chart should be reduced by $870. I was busy testing different strikes and forgot to verify the existing strikes after I chose the final butterfly strikes.

Friday, November 30, 2012

Adjusted high probability portfolio with butterfly

The market has been showing signs of turning bullish at the intermediate term level, with the 2nd confirmation date on 11-23 (which is a half trading day due to Thanksgiving) as noted by IBD and an impressive bullish reversal day on 11-28.

Yesterday, RUT rose significantly and my RUT position reached the adjustment point due to both price increase and volatility drop.
I played with unbalanced butterfly spreads in order to reduce delta & vega while increase theta. Eventually, I settled on a 30 point wide Dec unbalanced butterfly as shown below.
The adjustment expanded the upper break-even point of my RUT position by about 10 points. So the overall portfolio P&L chart also has increased upper BE point as shown below. Note it's delta is still quite large at the moment.


Wednesday, September 19, 2012

Bid/Ask Prices for RUT Butterfly

One day before RUT expires, I closed my RUT Butterfly spread for a break-even trade.

It was added as an adjustment to the smooth portfolio. At the time, I placed a limit order that was $0.05 above mid price and it was filled within 10 minutes, as market was fluctuating a little bit. Today, the bid/ask prices to sell the butterfly was wide. The bid was around -$1.10. Yes, it's a negative sign here. The ask was around $4 and mid was $1.20 to $1.70 for a while. My limit order of $1.65 was filled in about half an hour as RUT dipped temporarily.