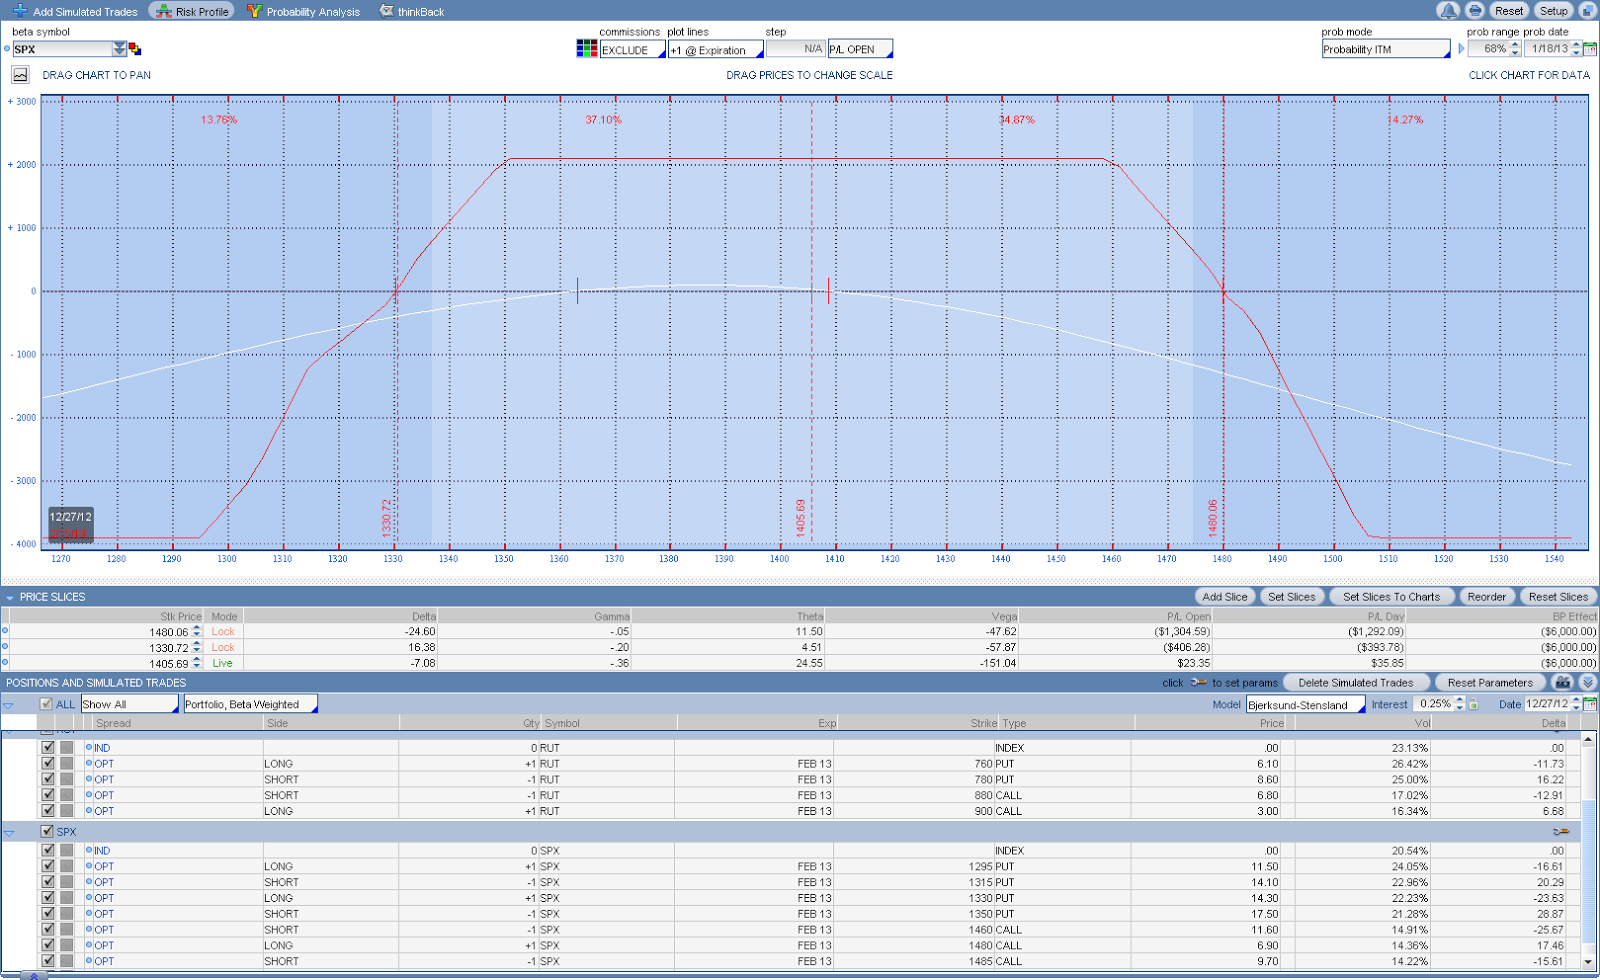
Yesterday was the 58th day to August SPX option expiration. So I started my 1st option premium selling trade for August and will continue to add August income trades to my portfolio in the next few days, pretty much one trade for each other day. This is a typical trade with short options of Delta around +/-0.23 for a credit of $6.65. I could have sold credit over $7.00 with other strikes of Delta 0.25. But I chose smaller credit for higher probability after looking at the resistance and support level.
If the market does not show any significant bearish signs, I'll use all iron condors for the August portfolio. Otherwise, I may use verticals and double calandars for it. On the 4th trade, I'll assess my portfolio Delta and consider adjusting the Delta with multiple trades that receive smaller credits. If that is the case, I'll also split the trade into two days in order to reduce the risks.
Currently, the SPX option chain still projects a higher possibility of downward movement in the future, since the average monthly volatility values are higher for longer time expiration series. We'll see if this term structure will be changed in the next few days.
Showing posts with label iron condor. Show all posts
Wednesday, June 19, 2013
Tuesday, May 21, 2013
Opening July SPX Iron Condor for non-directional option income portfolio
With 58 days to SPX expiration, it's time to get into a new option cycle. I tried to get $6.85 credit for the same IC yesterday but it was not filled as the market was falling in the later half of the trading hours. Today, market seemed to be rising slightly and the same order was filled in a couple of minutes at mid day.
I edited the chart a little bit so that it's easy to see the break-even levels, the option inventory and its Greeks, and the June probability in one chart as shown below. Again, I'll continue to build the positions in the next few days and the goal is to exit around June expiration time.
I gave the downside a little more room as usual among the conflicting market signals. This time, I think it's still possible to have a pullback for this extra falling room, even though the overbought market can also continue to be overbought for a while. The market has not shown the weakness that I'm looking for yet: distribution days in volume, churning of price actions, over-complacency as exhibited by lower VIX (VIX is not low when compared to the new high prices), etc.
I edited the chart a little bit so that it's easy to see the break-even levels, the option inventory and its Greeks, and the June probability in one chart as shown below. Again, I'll continue to build the positions in the next few days and the goal is to exit around June expiration time.
I gave the downside a little more room as usual among the conflicting market signals. This time, I think it's still possible to have a pullback for this extra falling room, even though the overbought market can also continue to be overbought for a while. The market has not shown the weakness that I'm looking for yet: distribution days in volume, churning of price actions, over-complacency as exhibited by lower VIX (VIX is not low when compared to the new high prices), etc.
Saturday, April 27, 2013
The actual time decay Chart of OTM option Theta and Vega
I'm interested to understand the real time-decay of my high probability option selling monthly income portfolio. I tried to use the TOS software without success, since it's designed to show the Greeks of various strike prices mainly. The ThinkScript has some bugs that prevent me from writing a script to display the time decay for every trading day. If ThinkOrSwim can fix the bugs, I may be able to design such a script for TOS chart.
For now, it's possible to display Theta and Vega hourly chart for a single option. So I used a sold SPX May put as the initial example which is shown below. The TOS chart also has a bug that prevent me to display it in daily chart. I had to use intraday (4 hour is selected to present more data) chart for this purpose.
As we can see from the chart, the sold put kept losing value as time passed by and SPX rose. It's apparent that Vega kept losing value as time passed by. It also reacted inversely to the SPX price (in the same direction as IV). My goal is to display implied volatility and Vega's impact on option values. Unfortunately, the IV functionality in ThinkScript is not working. I'm waiting for a response from TOS tech support to see if they are going to fix these type of issues.
The Theta time decay ((32.5-25)/32.5 = 23%) in last month was not that much when compared with that ((170-57)/170 = 66%) of the Vega. The Theta's reaction to SPX's price is similar as Vega: a reverse relationship with price (direct relationship with IV). Theta peaked on 2nd last Thursday as that was the lowest price day of SPX in the period. At the same day, the put option price also had a smaller peak to the market sell-off.
It looks to me an iron condor with negative Vega would benefit more time decay than a double calendar which has positive Vega if the spreads are opened two months before expiration. Is it really true? I'll have to analyze it in a future post.
What it really matters is that the put option price has been falling down since the open date. This is the ultimate effect of all Greeks. I'll continue to monitor the option price drop till the expiration day to get a overall picture of the option time decay.
Update: Since this post is becoming one of the popular ones of my blog, I'd like to update additional thoughts here.
1. As shown in the top section of the graph, it's apparent that Delta or index price changes have the most significant impact on option prices. The sold put option is out of the money, so the option price is made of time value solely. Using a moving average of the option price in the chart may better illustrate the decay of time value. I can do that in a future post.
2. Option Theta value becomes larger as the option price increases. But the percentage of Theta over time value may change different. I will create a ThinkScript to track the Theta value as a percentage of time value in a future study as well.
For now, it's possible to display Theta and Vega hourly chart for a single option. So I used a sold SPX May put as the initial example which is shown below. The TOS chart also has a bug that prevent me to display it in daily chart. I had to use intraday (4 hour is selected to present more data) chart for this purpose.
As we can see from the chart, the sold put kept losing value as time passed by and SPX rose. It's apparent that Vega kept losing value as time passed by. It also reacted inversely to the SPX price (in the same direction as IV). My goal is to display implied volatility and Vega's impact on option values. Unfortunately, the IV functionality in ThinkScript is not working. I'm waiting for a response from TOS tech support to see if they are going to fix these type of issues.
The Theta time decay ((32.5-25)/32.5 = 23%) in last month was not that much when compared with that ((170-57)/170 = 66%) of the Vega. The Theta's reaction to SPX's price is similar as Vega: a reverse relationship with price (direct relationship with IV). Theta peaked on 2nd last Thursday as that was the lowest price day of SPX in the period. At the same day, the put option price also had a smaller peak to the market sell-off.
It looks to me an iron condor with negative Vega would benefit more time decay than a double calendar which has positive Vega if the spreads are opened two months before expiration. Is it really true? I'll have to analyze it in a future post.
What it really matters is that the put option price has been falling down since the open date. This is the ultimate effect of all Greeks. I'll continue to monitor the option price drop till the expiration day to get a overall picture of the option time decay.
Update: Since this post is becoming one of the popular ones of my blog, I'd like to update additional thoughts here.
1. As shown in the top section of the graph, it's apparent that Delta or index price changes have the most significant impact on option prices. The sold put option is out of the money, so the option price is made of time value solely. Using a moving average of the option price in the chart may better illustrate the decay of time value. I can do that in a future post.
2. Option Theta value becomes larger as the option price increases. But the percentage of Theta over time value may change different. I will create a ThinkScript to track the Theta value as a percentage of time value in a future study as well.
Wednesday, April 17, 2013
Adjusted May non-directional option portfolio for more neutral Delta
Market was selling off early today and my RUT position showed some damage as RUT dropped below $905 while the SPX gained some value as its position had some negative Delta. The following chart was intended to recreate the portfolio P&L situation before adjustments (but it's captured after adjustment since I forgot to capture it before adjustments). I also marked the P&L zone changes in the chart.
Since the recent dramatic market moves happened 3 weeks after the initial positions were established, there was no major damage to the portfolio and the Delta was close to -20 before my adjustment (not -36 at which point I usually make adjustments).
When looking for adjustment strategies, I felt the VIX shot up way above the Bollinger band and may come down later. So I did not use calendars alone and used a bear call vertical spread as well. After the adjustments, my portfolio has a significantly reduced Delta and acceptable Vega. The Theta is also significantly higher as well. My goal is to close the portfolio some time next week if market gives me a profit opportunity.
It should be noted that in this highly volatile day, my orders for the RUT spreads were all filled with market price quickly.
Since the recent dramatic market moves happened 3 weeks after the initial positions were established, there was no major damage to the portfolio and the Delta was close to -20 before my adjustment (not -36 at which point I usually make adjustments).
When looking for adjustment strategies, I felt the VIX shot up way above the Bollinger band and may come down later. So I did not use calendars alone and used a bear call vertical spread as well. After the adjustments, my portfolio has a significantly reduced Delta and acceptable Vega. The Theta is also significantly higher as well. My goal is to close the portfolio some time next week if market gives me a profit opportunity.
It should be noted that in this highly volatile day, my orders for the RUT spreads were all filled with market price quickly.
Tuesday, March 26, 2013
Exited all April high probability positions to open May option inventory
I'd been looking for opportunities to exit April positions last week, as I preferred to use options with about 30 days to expiration for smooth portfolio P & L changes. But the portfolio of Delta -25 & Vega +300 showed some losses (reduced from initial $600+ to $300) last week, as the market was moving sideways.
However, the portfolio P&L changed quickly yesterday AM, as market was pulling down less than 10 points. It was a surprise to me that the P&L switched from -$350 to +$350 when I started reviewing my portfolio around 11:00AM EDT. I had seen SPX dropping 10 points last week, but the portfolio did not act this much.
I was wondering what happened at the time (Monday morning). I guessed the volatility was higher at the moment, which caused my Vega positive portfolio to increase value. Additionally, there were two weedend days of Theta decay which could be $200 as Theta was around 100. I thought market makers started weekend time decay on Thursday PM usually. But it seems that not always true, particularly if market is expecting some important events, such as European issues. Although Delta dropped to -12 from over -25, Gamma also increased to around 2.0+ which meant a 10 point movement of SPX would cause 20 point change in Delta.
Anyway, I'm glad I did close all of my trades which were for April yesterday. It took about one hour to exit all of them. As I was closing trades one by one, the market stopped bleeding and started bouncing up. So I believe I did not get the $350 profit, as I closed the calendars which made good profits for the day first. When I started to close the IC's, their daily profit started to dwindle. In the end, I might be just flat for April. I should know the exact numbers in my quarterly review.
Overall, I felt OK for this month to be flat. The last calendar adjustment worked great and market finally respected statistics in the last week by resting somewhat. Its IV went up since I bought the calendars.
I opened an SPX & RUT iron condor respectively, immediately after the exits yesterday. Today I opened another SPX IC with short Deltas around +25 & -21. The current P&L chart is shown below. I plan to enter the last RUT position tomorrow to complete my opening May portfolio with 50 days to expiration.
However, the portfolio P&L changed quickly yesterday AM, as market was pulling down less than 10 points. It was a surprise to me that the P&L switched from -$350 to +$350 when I started reviewing my portfolio around 11:00AM EDT. I had seen SPX dropping 10 points last week, but the portfolio did not act this much.
I was wondering what happened at the time (Monday morning). I guessed the volatility was higher at the moment, which caused my Vega positive portfolio to increase value. Additionally, there were two weedend days of Theta decay which could be $200 as Theta was around 100. I thought market makers started weekend time decay on Thursday PM usually. But it seems that not always true, particularly if market is expecting some important events, such as European issues. Although Delta dropped to -12 from over -25, Gamma also increased to around 2.0+ which meant a 10 point movement of SPX would cause 20 point change in Delta.
Anyway, I'm glad I did close all of my trades which were for April yesterday. It took about one hour to exit all of them. As I was closing trades one by one, the market stopped bleeding and started bouncing up. So I believe I did not get the $350 profit, as I closed the calendars which made good profits for the day first. When I started to close the IC's, their daily profit started to dwindle. In the end, I might be just flat for April. I should know the exact numbers in my quarterly review.
Overall, I felt OK for this month to be flat. The last calendar adjustment worked great and market finally respected statistics in the last week by resting somewhat. Its IV went up since I bought the calendars.
I opened an SPX & RUT iron condor respectively, immediately after the exits yesterday. Today I opened another SPX IC with short Deltas around +25 & -21. The current P&L chart is shown below. I plan to enter the last RUT position tomorrow to complete my opening May portfolio with 50 days to expiration.
Saturday, March 23, 2013
Selecting single wing strike price distances for iron condors
When selling option premium with iron condor spreads, it's usually true that the wider the distance of strike prices of either wing (one side of the spread), the lower the return on margin, if the sold option strike is fixed. It's understandable since wider strike distance of a single wind means wider break-even points, or high probability of success.
If we want to use a similar amount of margin for IC spreads, we face a selection of wider single wing strikes like $20 apart or narrower strikes like $5 for $SPX/$RUT iron condors. With narrower single wing strikes, we need to sell more contracts to reach the same level of margin.
I guess the answer depends, mainly, on whether we need wider break-even points or not. The commission costs and transaction costs are less important in making the decision here usually. If we sell far OTM iron condors with 80% or better probability of success, and our adjustment strategy involves closing (or rolling) the IC once the position has certain degree of damage, we could probably choose narrower single wing strikes ($5) for higher ROM.
On the other hand, if the short strike of the IC is sold less OTM as in the above case, the success probability will be lower. So, we may create a little bit more wiggle room with a wider single wing strike distance ($20). Additionally, if we'd like to hedge against damaging IC positions without closing (some times called rolling) the wings, it would worth having larger BE points with less ROM. This is what I usually do. One of my current SPX April IC has a short $1555 call with a upper BE around $1561. It's damaged modestly as $SPX is at $1557 and hedged by some calendars right now. The damage would be bigger if I used narrower single wing strikes with higher ROM.
If we want to use a similar amount of margin for IC spreads, we face a selection of wider single wing strikes like $20 apart or narrower strikes like $5 for $SPX/$RUT iron condors. With narrower single wing strikes, we need to sell more contracts to reach the same level of margin.
I guess the answer depends, mainly, on whether we need wider break-even points or not. The commission costs and transaction costs are less important in making the decision here usually. If we sell far OTM iron condors with 80% or better probability of success, and our adjustment strategy involves closing (or rolling) the IC once the position has certain degree of damage, we could probably choose narrower single wing strikes ($5) for higher ROM.
On the other hand, if the short strike of the IC is sold less OTM as in the above case, the success probability will be lower. So, we may create a little bit more wiggle room with a wider single wing strike distance ($20). Additionally, if we'd like to hedge against damaging IC positions without closing (some times called rolling) the wings, it would worth having larger BE points with less ROM. This is what I usually do. One of my current SPX April IC has a short $1555 call with a upper BE around $1561. It's damaged modestly as $SPX is at $1557 and hedged by some calendars right now. The damage would be bigger if I used narrower single wing strikes with higher ROM.
Saturday, February 2, 2013
Exiting positions to reduce portfolio Delta
Yesterday, the markets rose after a short 2 day fall after the FED meeting. It appeared that the current FED is very market friendly and its announcements usually do not make market fall for long. It's still the same story of the FED announcements as I noticed before in my FED & VIX analysis. VIX made a significant drop as well.
In the mid-day, my monthly income portfolio had delta reaching a Delta of -74, with a Gamma of -4. The SPX iron condors were challenged on the upside.
So I had to make a Delta adjustment. With about 13 days to expiration, I had to close the most-damaged IC. The resultant portfolio Delta was -40. I'll close all positions by next Friday or close them early depending on how market acts.
In the mid-day, my monthly income portfolio had delta reaching a Delta of -74, with a Gamma of -4. The SPX iron condors were challenged on the upside.
So I had to make a Delta adjustment. With about 13 days to expiration, I had to close the most-damaged IC. The resultant portfolio Delta was -40. I'll close all positions by next Friday or close them early depending on how market acts.
Wednesday, January 23, 2013
Reducing Feb portfolio delta
After yesterday's adjustment on SPX positions, the market continued to rise. Today, the portfolio had reached a Delta of -95. I considered it as too high for my portfolio. It had more than doubled the value of 36 for initial portfolio positions as I analyzed before, even though the current portfolio margin was about twice as the starting margin. So I reviewed existing positions and decided to close out the following IC which had its price close to the right drop-off point and a Delta of about 20.
After closing this IC with a minor profit, the overall portfolio still has a Delta of -75. The remaining Vega is about -325, equivalent to a Delta of 30 at the moment. Thus the effective Delta is around -45. I'll see how market does tomorrow to decide if any further action is required.
Tuesday, January 22, 2013
Iron condor trade adjustments to keep portfolio non-directional
With 23 days to SPX Feb option expiration, the SPX position P&L chart showed its price reached the adjustment point, since the market continued to push higher. Because the market has not pulled back for a while, I expected it to have a good chance to do that. So I decided to adjust only for the offending IC portion of the SPX positions.
To keep a similar profit potential, I had to increase the position size a bit. When playing with the 20 point wide and 10 point wide IC's of SPX on each side, I realized that the 10 point wide IC offered higher ROM (3.10/10=31% vs 5.15/20=26%). So I sold more 10 point wide IC on each side and closed the offending IC. In reality, it took a while to get the offending IC to be filled at 10 cents higher than the mid price of the IC.
The adjusted portfolio still have relatively high negative Delta, indicating the bias to a market pullback for it to become more profitable.
To keep a similar profit potential, I had to increase the position size a bit. When playing with the 20 point wide and 10 point wide IC's of SPX on each side, I realized that the 10 point wide IC offered higher ROM (3.10/10=31% vs 5.15/20=26%). So I sold more 10 point wide IC on each side and closed the offending IC. In reality, it took a while to get the offending IC to be filled at 10 cents higher than the mid price of the IC.
The adjusted portfolio still have relatively high negative Delta, indicating the bias to a market pullback for it to become more profitable.
Thursday, January 10, 2013
Adjusted RUT Iron Condor for Feb Income Portfolio
Market did not make meaningful retracement in the last few days. The RUT 880/900C to 780/760P IC initiated on 12-26 has its price near the right drop-off point. It's apparent from the overall RUT position P&L chart as shown below.
So I rolled the IC up for $6.60 credit after closing the original IC for $9.60. Then I added another half sized IC for $3.40 to make up the deficit. It increased the margin by $1000. The new portfolio chart looks pretty good for this market I think, even though it has a delta of -31 vs Vega of -350.
In analyzing potential adjustments, I played with calendars of multiple strikes and found the calendar spread adjustments would offer more Delta, but less Theta at this time (35 days to expiration). So I did not use calendars even if I think the volatility VIX is relatively low at around 13 (not much down side potential for VIX).
On my IWM bull diagonal spread, the short strike Jan$86 has its Delta reaching to 0.75, so I rolled it up to Feb$89c of Delta 0.33.
So I rolled the IC up for $6.60 credit after closing the original IC for $9.60. Then I added another half sized IC for $3.40 to make up the deficit. It increased the margin by $1000. The new portfolio chart looks pretty good for this market I think, even though it has a delta of -31 vs Vega of -350.
In analyzing potential adjustments, I played with calendars of multiple strikes and found the calendar spread adjustments would offer more Delta, but less Theta at this time (35 days to expiration). So I did not use calendars even if I think the volatility VIX is relatively low at around 13 (not much down side potential for VIX).
On my IWM bull diagonal spread, the short strike Jan$86 has its Delta reaching to 0.75, so I rolled it up to Feb$89c of Delta 0.33.
Labels:
Adjustment,
diagonal spread,
double calendar spread,
iron condor,
position trade,
RUT,
VIX
Monday, December 31, 2012
Completed Feb high probability option income portfolio
Today, I finally completed my February high probability option portfolio by selling the RUT iron condor as shown below. This month's portfolio is made of all iron condors, because I still consider the market is within an uptrend. The portfolio Vega is about -200. It will gain $200 if VIX drops 1 point or SPX rises slightly over 10 points according to my calculation before (just one way for estimation). To make the portfolio market neutral, I also built a negative delta. In case market drops, the negative delta should help to increase the portfolio value, while the negative Vega causes the portfolio to lose value.
Today's order which was $0.05 below mid-price roughly was filled within 20 minutes (the mid price fluctuated during this time with a bias to the up side). Last Friday, I tried to order a RUT iron condor with slightly different strikes (10 points lower on put spread side). But it was a bit strange that it could not get filled, even if sometimes the mid price was more than $0.20 over what my order asked for. I checked the open interests and volumes of the strikes and saw the OI were over 1000's and volumes were in the range to 100's. But the TOS option sizzle index was 0.65, suggesting a low volume day due to holiday season.
Thursday, December 27, 2012
Selling more premiums for Feb high probability portfolio
Market dropped in the last couple of days with higher volumes and the current intermediate uptrend is in danger. With volatility shooting up, I sold more premiums via February RUT and SPX iron condors with about 50 days to expiration.
Since market can drop rapidly and usually rise at a slower pace, I selected short strike prices in the following way: the short put strike had a delta around -20 as analyzed before and the short call strike had a delta around +24. This slight change in my strike selection rule is partially inspired by Karen's interview, and partially intended to reduce the effect of Vega of the high probability portfolio.
Using the above rule, I sold a RUT iron condor yesterday as shown in the graph below. IC's always have negative Vega, which favors reduction of volatility (market to rise). So the small negative delta of the position can neutralize the effect of Vega somewhat, making the position more market neutral.
Today, I also sold another SPX iron condor. My current portfolio has a Beta-weighted delta of -7, accommodating some down side market movements. The graph below recorded my current positions on RUT & SPX. I plan to complete my Feb portfolio tomorrow by adding another RUT time-decaying position.
To calculate how much Delta is needed to offset the Vega to obtain a market neutral portfolio, I used ATR to correlate Delta and Vega of SPX in the following way. Currently, SPX has ATR(30) of 14.3 and VIX has ATR(30) of 1.2. If the weighted SPX Delta x ATR is in the same range of VIX ATR x Vega, then the portfolio is about neutral. Thus, the Vega should be around 10 times of Delta to maintain the neutrality.
As an example, my Feb RUT IC has Vega of -47 and Delta of -5.3 is in the above range, making it perfectly market neutral. My 1st Feb SPX did not opened in this way while the 2nd SPX IC did. In the future, I will follow this rule when I intend to build market neutral portfolio in sideways market.
Since market can drop rapidly and usually rise at a slower pace, I selected short strike prices in the following way: the short put strike had a delta around -20 as analyzed before and the short call strike had a delta around +24. This slight change in my strike selection rule is partially inspired by Karen's interview, and partially intended to reduce the effect of Vega of the high probability portfolio.
Using the above rule, I sold a RUT iron condor yesterday as shown in the graph below. IC's always have negative Vega, which favors reduction of volatility (market to rise). So the small negative delta of the position can neutralize the effect of Vega somewhat, making the position more market neutral.
Today, I also sold another SPX iron condor. My current portfolio has a Beta-weighted delta of -7, accommodating some down side market movements. The graph below recorded my current positions on RUT & SPX. I plan to complete my Feb portfolio tomorrow by adding another RUT time-decaying position.
To calculate how much Delta is needed to offset the Vega to obtain a market neutral portfolio, I used ATR to correlate Delta and Vega of SPX in the following way. Currently, SPX has ATR(30) of 14.3 and VIX has ATR(30) of 1.2. If the weighted SPX Delta x ATR is in the same range of VIX ATR x Vega, then the portfolio is about neutral. Thus, the Vega should be around 10 times of Delta to maintain the neutrality.
As an example, my Feb RUT IC has Vega of -47 and Delta of -5.3 is in the above range, making it perfectly market neutral. My 1st Feb SPX did not opened in this way while the 2nd SPX IC did. In the future, I will follow this rule when I intend to build market neutral portfolio in sideways market.
Analyzing short put delta of iron condor vs time decay
A few days back, I analyzed the relationship between OTM put Delta and Theta to understand how time decays for my short iron condors with different short put strikes.
I selected a short RUT put strike of Delta -0.22 in my 20 point wide put spread and another RUT short put strike of Delta -0.25. I kept the call spread within the iron condor the same in this analysis. The former (Delta = -0.22) had a slightly higher Theta (8.28) and Delta (-4.8) as shown in the graph below, while the Vega was similar (actually slightly higher as well) in both cases.
For the IC with short put of -0.25 Delta, it had a slightly lower Theta (7.95 vs 8.28) and Delta (-3.76 vs -4.8) while Vega remains close (-48.98 vs -49.28). The differently colored curves showed P&L of 6 calendar days apart. So the farther OTM IC would achieve a profit of $265 (vs $259 in closer OTM IC) near Jan expiration time if price does not change.
Overall, the analysis indicates time decays a little faster for the farther OTM option IC than the closer OTM option IC from 8 weeks to 4 weeks ahead of their expiration. Since I plan to exit positions 4 weeks before expiration whenever possible (as analyzed in a previous post), this farther OTM selection suits my strategy well and it provides higher probability as well. The cost of the change is less credit at the opening( but it does not cause slightly lower profit at the exit as one would expect).
I selected a short RUT put strike of Delta -0.22 in my 20 point wide put spread and another RUT short put strike of Delta -0.25. I kept the call spread within the iron condor the same in this analysis. The former (Delta = -0.22) had a slightly higher Theta (8.28) and Delta (-4.8) as shown in the graph below, while the Vega was similar (actually slightly higher as well) in both cases.
For the IC with short put of -0.25 Delta, it had a slightly lower Theta (7.95 vs 8.28) and Delta (-3.76 vs -4.8) while Vega remains close (-48.98 vs -49.28). The differently colored curves showed P&L of 6 calendar days apart. So the farther OTM IC would achieve a profit of $265 (vs $259 in closer OTM IC) near Jan expiration time if price does not change.
Overall, the analysis indicates time decays a little faster for the farther OTM option IC than the closer OTM option IC from 8 weeks to 4 weeks ahead of their expiration. Since I plan to exit positions 4 weeks before expiration whenever possible (as analyzed in a previous post), this farther OTM selection suits my strategy well and it provides higher probability as well. The cost of the change is less credit at the opening( but it does not cause slightly lower profit at the exit as one would expect).
Friday, December 21, 2012
Sell to open SPX FEB Iron Condor and EEM Jan$44 Call
With about 2 month to Feb expiration, I sold an iron condor spread of SPX today as market tanked in monster volume (partly due to quadruple witching expiration of options and futures). My premium sell order for the SPX spread was 10 cents below the mid price as usual. It got filled immediately. The target exit time is 1 month later. The delta of the short strikes were around 23, presenting a high probability (66%) of ITM by Jan expiration time as shown in the graph below. I plan to add to my Feb option inventory every other day later until I complete all my positions of the Feb portfolio.
The volatility $VIX was very high in the last few days and it shot up more than 6% at this morning. Under normal cases, $VIX was supposed to be in the bottom level of its recent two month range, considering SPX was at the top level of its trading range. This type of divergence signaled there were heavy hedging going on against the fiscal cliff and there would be a big move in the market in either direction. So I sold Jan$44c of delta around 0.3 on EEM today to hedge the down side risk a little bit. I have June$40c opened a few weeks ago. So now I converted it into a diagonal spread.
Labels:
diagonal spread,
iron condor,
SPX,
Starting portfolio,
VIX
Tuesday, December 11, 2012
Rolled up SPX Iron Condor in high probability paper portfolio
Yesterday, my paper portfolio testing 2 month high probability, market neutral strategies showed a delta of -39 and prices went to the right slope of P&L chart. So I reviewed the positions and found the SPX Iron condors required adjustment.
My adjustment goal was reducing Delta while maintaining similar profit if possible. To buy back the $11.40 IC and sell the new $10.05 IC, I had a deficit of $1.35. Thus, I also rolled up the $1.05 put spread (debit) to a new $3.05 put spread (credit). In this way, the overall SPX roll gave the portfolio an extra credit of $0.65 which offsets the transaction costs and commissions.
After the adjustment, the P& L Chart looks like below. It still has a delta of -27, a bit higher due to the RUT positions.
My adjustment goal was reducing Delta while maintaining similar profit if possible. To buy back the $11.40 IC and sell the new $10.05 IC, I had a deficit of $1.35. Thus, I also rolled up the $1.05 put spread (debit) to a new $3.05 put spread (credit). In this way, the overall SPX roll gave the portfolio an extra credit of $0.65 which offsets the transaction costs and commissions.
After the adjustment, the P& L Chart looks like below. It still has a delta of -27, a bit higher due to the RUT positions.
Labels:
Adjustment,
iron condor,
Paper trade,
SPX,
vertical spread
Wednesday, November 7, 2012
Rolling down of Dec SPX Iron Condor
Market sold off hard after the election day. In the paper-traded 2 month out portfolio, the SPX positions showed a need for adjustment. Specifically, market price has fallen into the left slope of an iron condor curve. So I rolled the IC down about 20 points. I still got an extra credit of $0.65, due to the higher volatility and plenty of time to expiration. The new SPX P&L curve is shifted left side about 20 points now. Note the portfolio had a 10% profit of $600+ yesterday before the sell-off.
Wednesday, October 17, 2012
November Inventory Adjustment
Market had advanced on stronger volumes in the last couple of days, causing the option income portfolio minor damages as shown in the image below.
In particular, the SPX price moved to the right shoulder of profit graph. With 29 days to go, I still have time for iron condor. So I rolled up the spreads of both calls and puts of an original iron condor to points where there are about 25% to 20% of expiring ITM. The resulted P&L curve still looks smooth, even though the max potential profit is reduced. The new return rate is in my acceptable range. The rolling of IC does not neutralize delta too much, only 5 points or so.
Note the profit in the new portfolio should be the value indicated in the image minus about $360, to account for the debit of closed spread.
In particular, the SPX price moved to the right shoulder of profit graph. With 29 days to go, I still have time for iron condor. So I rolled up the spreads of both calls and puts of an original iron condor to points where there are about 25% to 20% of expiring ITM. The resulted P&L curve still looks smooth, even though the max potential profit is reduced. The new return rate is in my acceptable range. The rolling of IC does not neutralize delta too much, only 5 points or so.
Note the profit in the new portfolio should be the value indicated in the image minus about $360, to account for the debit of closed spread.
Friday, October 12, 2012
More Iron Condors for November Option Portfolio
In the last few days, I continued to build my monthly option income portfolio. Market are relatively calm with downward pressure. The portfolio looks good with one more position to be added next Monday.
With one week left for Oct, I rolled IYR Oct$64c to Nov$64c for $0.61, still slight bearish on it.
SPX Iron Condor 2 Month Out
The benefit of a 2 month-out iron condor is less volatile or more smooth during the first 30 day period. If price goes wrong in this initial period, adjustments are relatively easier to make. So if the trade can reach an acceptable profit target in the first 30 days, it will suit well for a conservative portfolio. Let me paper trade this concept for 3 months to investigate if this type of trades are good for my style.
The time frame will be initiating positions 70 to 60 days ahead of expiration and closing positions 40 to 30 days before expiration. If adjustments are made near the end of the trading period, I will give it some more time (7 to 14 days extra) for the adjustments to work out (reaching projected profit target around 8% to 10%).
Note comparing this trade with a single month out IC constructed with the same principal, it has about one half of Theta and Gamma. The delta and vega have similar values.
The time frame will be initiating positions 70 to 60 days ahead of expiration and closing positions 40 to 30 days before expiration. If adjustments are made near the end of the trading period, I will give it some more time (7 to 14 days extra) for the adjustments to work out (reaching projected profit target around 8% to 10%).
Note comparing this trade with a single month out IC constructed with the same principal, it has about one half of Theta and Gamma. The delta and vega have similar values.
Monday, October 8, 2012
Initiating November Option Inventory for High Probability Portfolio
With 38 days to go for November and a clean exit on October last week, I started building the November smooth portfolio. The plan is to diversify strikes and gradually complete the portfolio in the next few days. Today I completed the first sell of NOV SPX iron condor. It was a calm day and I got the fill price even better than mid price which was my limit order. What a surprise gift for Columbus day.
Subscribe to:
Posts (Atom)