Pages

Showing posts with label Successful Theta Traders. Show all posts

Sunday, June 15, 2014

A study of Super trader Karen's trading process

I've been interested in studying the trading process and mindset of successful traders. Today, I reviewed what I learned from Karen's interviews from the trading process perspective.

Karen treats trading as a process and manages the process all the time. As far as I can see, her trading process involves the following elements as discussed in her interviews:
o   A suitable set of strategic trading rules,
o   An advanced trading software platform,
o   A successful trading mindset and psychology,
o   A daily trading routine,
o   A trading number game management,
o   An experienced trading team,
o   A Sufficient amount of time and money for trading and learning, and
o   Others.

Karen’s daily trading routine starts from market open hour till the end. The constant watch on the market by her trading team allows them to react to market changes promptly. Karen’s trading rules help them staying away from over-trading or over-adjusting. Her high degree of confidence on the high probability trades enables her of proper trade actions in the face of market uncertainty.

Karen treats trading as a number’s game so that she can play it objectively. She enjoys playing the big game all the time and taking the market challenges as well. There are no feelings wrapped around her trades or positions, as they are just numbers to her. The ability to turn emotions and perceived risks into a set of trading numbers and to focus on the numbers helps traders to decouple themselves from emotions and irrational trading actions. The emotion and fear are the biggest obstacles in trading and they take down most traders. The focus on trading numbers takes away the feeling of heart-ripping during adverse market conditions. As a result of the application of high probability trades by going far out of the money, a heavy percentage of Karen’s positions are winners.

Karen had discussed her learning and trading improvement process. She had more failures than successes in initial years. She was willing to invest in learning knowledge with a large amount of money and time that many other people may not be comfortable with. Her education fee at Investools alone cost over 20K USD. Small traders may have this limited amount in their trading accounts.

Karen established a tremendous trading team of about 6 members. 5 of them are experienced retail traders and 1 is an accountant. She encourages different ideas from team members. They usually will listen to each other, discuss the ideas and agree as a group. From time to time, they will test water with new ideas using a small amount of capital. If the new idea is proven to be working, then they don’t hesitate to apply it in full scale. The selling of weekly option was a good example of this process of adopting new ideas.

Some traders may get extremely disturbed if the temporary position loss becomes very big. Karen does not get emotional about any of her positions. When positions are in danger, she will do whatever it takes to fix them and make them back to the original profit at the expiration date as described in Section 6 Trade Adjustment Rules. She is not bound by the future direction of market moves, but always reacts to it if the ITM probability and profit percentage of her positions indicate to her for adjustments.

Karen suggested traders to look at the profit and loss numbers of the portfolio but not to focus on the P&L. This is reflected on her trading team structure as well as there is only one accountant (vs 5 to 6 traders). With this team, the traders should be able to focus more on the other important trading numbers. Personally, I think the key numbers Karen discussed in the interviews can be summarized as the following:
·         ITM probability
o   First factor used to determine if opening, closing or adjustment is required
·         Prices and trend of the underlying
o   Second factor used to determine if adjustment is required
·         Stress-tested market crash losses vs net liquidation value
o   Critical number that indicate how many contracts to sell
·         Option premium changes and time to expiration
o   Available options for adjustments


Karen stated she is willing to take losses when necessary and she will keep existing profit in her positions also. However, there were no examples discussing when to give up positions for losses (probably after the portfolio margin runs out). It’s worthwhile noting that Karen did not indicate any rules based on position losses. She did not mention any direct trade reaction to the amount of loss of a position. Her trade adjustment rules are based on ITM probability and the current market trends.

Saturday, June 7, 2014

Which index option provides better premium return per volatility?

Major indices have their own volatilities over the last 5 years as shown in the chart below. The volatility $RVX of RUT is consistently higher than those ($VXN and $VIX) of NDX and SPX. For example, RUT had a 59% higher volatility than SPX on June 6 of 2014. This difference was on the high side. On March 1 of 2010, RUT volatility was 17% ((20.43-17.42)/17.42) higher than that of SPX which was a normal difference. The volatility of NDX is only slightly higher than that of the SPX most of times.

Karen stated she prefer to trade SPX over NDX and RUT. She had a good year (probably 2009) trading RUT with relatively higher return. But she likes the lower risks trading SPX. She does not want to trade NDX which has higher risk with similar return rate.
How do we know we are getting a good return for the risk of a trade using each vehicle of different volatility? I made a simple attempt to investigate the covered return per implied volatility of each trade and showed the results in the top right corner of the above chart. Basically, the covered return for each call and put option on 6-7-2014 were obtained from the TOS analyzer. The options had 41 days to their July expiration date. The calls had around 10% ITM probability and the puts had around 5% ITM probability. The implied volatility of each individual option was obtained from the TOS analyzer as well. I assume the ratio of covered return over IV would give us a fair measurement of return for the IV of each trade.

As can be seen in the table embedded in the above chart, selling puts of SPY, IWM, and QQQ would have similar returns (about 6%) on this date. Given SPY is less volatile, SPY put would be a good choice. For the short calls with 41 DTE, SPY does have lower returns (12.8%) than IWM (14.5%) and QQQ (14.6%). Please be advised that this study includes one set of data from one day only. It may not be generalized for other days. Further study is required to understand it more deeply.

Sunday, May 25, 2014

Investigating stress tested portfolio margin for Karen style positions

Thanks to the help from Tom of the Karen Study Group, I was able to set up my TOS paper account to portfolio margin and came up with the following initial understanding.

Karen uses a unique method to manage the allocated trading capital. She pretends the market dropping over 12% in her margin crash tests while TOS portfolio policy stated a minimal 10% drop for portfolio margin using broad index based vehicles. Using the TOS analyzer, she watches potential crash loss in the portfolio against the net liquidation value of her account as shown in the following picture. On the Analyzer tab, the daily P&L numbers at 10% up and 12% down must not exceed net liquidation value. 
In the above chart, the +6% and the -10% slices are broker SPX stress test prices. All the other slices beyond them are Karen’s stress test points. In order to maintain sufficient adjustment capital during market sell-offs, Karen lowers her stress test point below the 10% down point by another 100 to 200 offset points, depending on the long term market volatility condition.
  • · 2013 Crash price (cushion) = (Current price – 100) x 88% due to lower volatility.
  • · 2011 crash price = (current price – 200) x 88% due to higher volatility.


According to Figure 2: SPY and Its Implied Volatility Since 2008 shown before, there are 2 levels of IV in the past few years. Starting at January of 2013, the volatility made a lower low and stayed within a much narrow and lower channel ever since. Thus, it makes sense to use the smaller and pretended drop of 100 points of SPX in the crash price calculation starting at the beginning of 2013.

In my personal opinion, it will be a good time to switch to the larger drop of 200 points of SPX when the IV makes a higher low and forms a newly elevated channel in the future. If the volatility VIX is generally lower to a level of 11 and 12 at its bottom (this is a long bull market condition), the 100-point offset is used. If the volatility is higher to a level of 13 at the bottom of the VIX, the 200-point offset is used.
Additionally, it is easier in the TOS analyzer and more conservative if a Karen style trader uses the following formula to determine the crash price. Karen does not offer complete details of her trading system but encourages traders to come up with the system that they are comfortable with.

  • ·         crash price = current price x 88% - 100 or 200

According to the statements in the interview, the 12% crash down price has a probability of ITM of 5% approximately. Let’s investigate it using today’s data as a specific example. The SPX price is 1900 on May 25, 2014. The 12% down SPX price based on Karen’s stress test formula is 1584. There is a 53 DTE July 1585 put option of ITM probability of 2%. Although the probability to expire ITM on July expiration date is quite low, the probability to touch the strike of 1585 is a bit higher, probably twice the amount of expiration probability to 4 to 10%.
Now, we can study the margin requirement and its changes for the hypothetical position shown in the above chart. It’s clear that the opening or initial margin requirement is $6,291. The “Explain Margin” section embedded in the chart indicates the margin requirement changes from -10% to +6% of SPX price changes.
However, if SPX drops to 1565, a level looked by Karen style trader, the loss would be $19,968. Karen would make sure the loss number is less than the net liquidation value of the account on the opening day with the proper size of contracts. This amount of the loss would be higher than the initial margin requirement of $6,291. As of today, I’m not sure what would the new margin requirement be in this scenario. Would it become 4.9 times of the initial margin requirement to $30,869? How margin requirement changes in market crash conditions still needs investigation in the future.
Although the PM requirement changes according to market conditions for existing portfolio and the changes may be different for various brokerage firms, the net liquidation value of an short option account is more deterministic. Therefore, the net liquidation value is used as the basis for comparing the daily P&L number in Karen style trading.

It should be noted that the initial margin $6,291 of the position is dictated by the short call option at an upside movement of +6% of SPX price as the down side movement of -10% requires a less amount of margin of $6,266 only. It implies more puts can be sold in trade adjustments if market tanks, because short put options require significant less margins. This is naturally helpful to obtain more credits to cover the deficit of put option rolling down or out when market crashes.


Sunday, May 4, 2014

Continued analysis of Karen style short put trades during flash crash

After the last post on flash crash study, I tried to create a couple of simulated trades for the flash crash option cycle using Super trader Karen's style and to test possible adjustments on the big down days (May 6 & 7 of 2010). The results were a bit surprising as the simulated positions did not pass the 30% ITM probability too much according to end-of-day data from TOS. The following is the details of my analysis of the simulated trades.

Karen discussed the flash crash day as a great day of option trading for her style. She mentioned she had to give up profits for a few months to get into a safe territory. Before the crash date, a portfolio of Karen style would have naked options of the May (14 DTE) and June (42 DTE) cycles most likely. The May options might be started more than 40 days ago in the last two weeks of March following the 56 day rule to open trades. The June options might be started over 14 days ago in the last 2 weeks of April. 

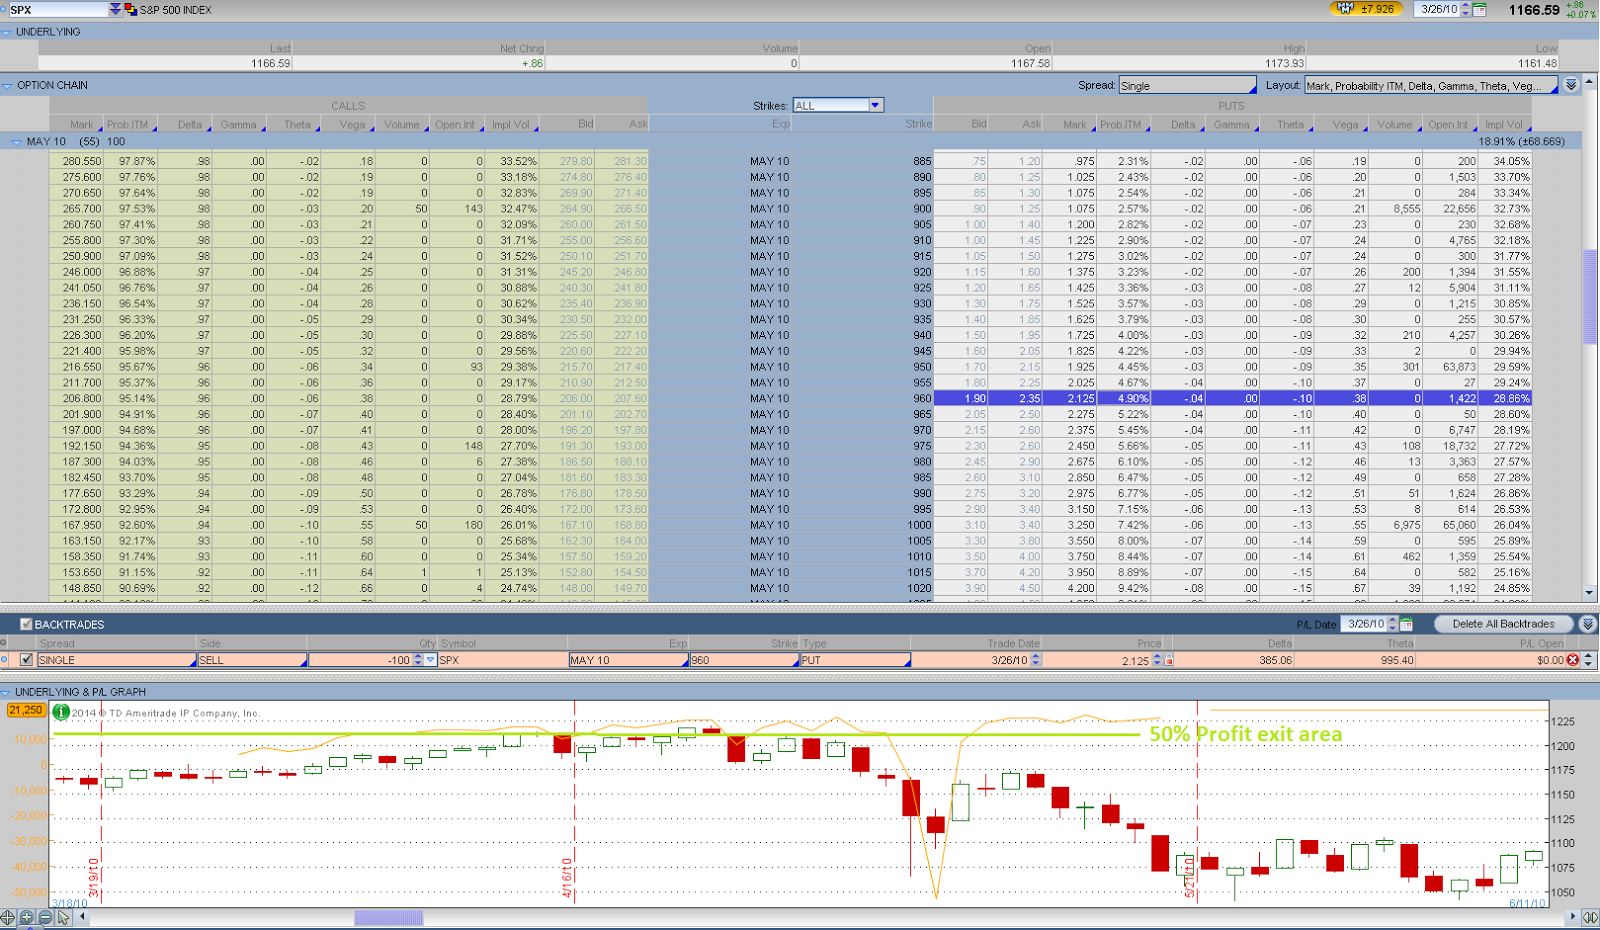
Let’s take a look at the life of the May put options first. As marked in the above chart, March 25 was the 56 DTE. On the next market down day on March 26, we could sell SPX May $960 put which had ITM probability of 4.90% for $2.13. However it was a bit surprising that the actual trading volume for the strike was minimal. It looked like Karen did not trade on that day. The option reached 50% profit zone in one week or two. If we took profit following the rules in Section 5 Exit Rules and Winner Management, then everything else would be simple for this position. Otherwise, it would be a rough ride. On May 7 with 14 days to expiration, the put option price was $7.4 with ITM probability of 13.2%, about 3.5 times of the originally sold price. With Karen’s winner management rules, the option would be let expire worthless for a maximum profit since it might not reached the adjustment point. Overall, the May put options did not appear to be in real danger when compared against June put options at the flash crash according to this analysis.


Now, let’s study the life of the June put options. There were 56 days to expiration for June options on April 22, 2010. This day and the next day were up days for market as shown in Figure 11: SPX Daily Chart of Flash Crash of May 6, 2010. So we could sell calls in these two days.
On April 27, 2010 the market dropped significantly and it was a good time to sell puts. We could sell 100 contracts of June $935 put with a 4.88% ITM probability (Delta = 4) following Karen’s entry rules described in Section 3 Option Selection and Section 4.1 Entry (Legged in) Rules. The bid/ask prices were $2.00/$2.90 (middle price = $2.45) and the volume was over 500. 
Additionally, if the some puts were sold some time before the close of market, the trade could have seen June $950 strike having ITM probability at 5% (5.68% EOD) and sold these contracts for a premium around $2.45. The end-of-day price became $2.90 for the strike which indicated a $0.45 loss on the day. By the way, the actual volume of this specific put strike on the day was about 1.7K, the 2nd largest quantity for OTM strikes of the day.

According to Figure 12: The Life of a 5% ITM Probability Put Option Survived the Flash Crash, the June $950 put option’s ITM probability would have approached 30% at the lowest point of the flash crash day.  But it was unlikely that it exceeded the 30% ITM probability too much, even if the position losses could be 7 times of the original premium received. If the Karen trader stayed calm, did not get scared by the big account loss at the moment and followed the adjustment rules, there would be no need to adjust this position.


However, most retail traders are likely to get close to panic in the market crash environment, because they would find a huge loss number at the profit and loss field of the portfolio and figure out that the loss on paper would take many months to a year to recover. They may start to forget about rules and disciplines and execute special trades that would ruin the portfolio later on. Karen gave some help on how to deal with such psychological issues as discussed in Section 8 Psychology and Mindset.

Saturday, April 26, 2014

A review of May 6, 2010 flash crash and the far OTM put options

As part of my project of the study of Super Trader Karen, I worked on the analysis of surviving the flash crash using Karen's trade style in the last couple of week and would like to share the initial part of this analysis here. Any comments are welcome.

 On Thursday May 6 of 2010, the US stock market had a famous flash crash when Dow Jones Industrial Average crashed 1,000 points (9%) and S&P 500 Index crashed 100 points (9%). The VIX shot up 18 points (74%) on the day as market volatility exploded. However, the US stock market recovered most of the losses within a couple of days. The 5 minute chart is shown below as a reference to the flash crash market action.
Looking at the big picture, the US market was in a big and long bull market since the historical bear market bottom at March 2009. The flash crash occurred in the beginning of a market correction. The correction lasted for about 4 months ending in late August of 2010 and the fall from top to bottom was about 17%. Although the market crashed about 30 minutes only, the volatility remained extremely high for over one day, as the fear of continuing market crash stayed rampant in those two days.

From this experience of a 100 point crash of SPX, it should be easier for us to understand why Karen chooses a crash point of 100 or 200 SPX fall in her money management rules. In the following sub-sections, we’ll examine the available option chains first. It should help us to understand the possible trade adjustment options. Then, we’ll try to make up a hypothetical trade that is opened before the crash and required for trade adjustment.  It should help us to gain some insights on how our trade position reacts to market crashes and what kind of impacts the position will experience after the trade adjustments.

The Option Chains at the End of Flash Crash Day


As the market started to fall significantly on this day, the put contracts with the original 5% ITM probability would have its probability increased to over 30% rather quickly. A Karen style option trader would be likely to begin the normal trade adjustment strategy by rolling down or rolling out the part of the put options in the portfolio. Considering the trader would not know how deep the drop would be for the day when the probability reached 30% initially, it would be logical for the trader to roll down or roll out to the next month at first.

After reviewing the put option trading volumes and open interests of June, June Quarterly and July cycles, it looked like Karen’s team might have rolled down the June puts to a strike of $800. As shown in Figure 9 SPX June Option Chain on May 6, 2010, the strike had an ITM probability of 4.2% and trading volume of 53K on the day. The trading volume of put strikes of about 5% ITM probability for June Quarterly and July had so much less contracts that they did not appear to be traded by professional traders. For example, the June Quarterly puts at $800 with 4.79% ITM probability had 55 days to expiration which was close to the 56 day norm as Karen specified. But it had only 7 contracts traded for the day.

Note Karen stated she had rolled out to October time frame. But there were no October and November options available on the day of May 6, 2010 according to TOS. I assume Karen did not remember the exact months for her trade adjustments during the flash crash a couple of years ago before the interview.

As the market continued to fall deeper in the afternoon, the Karen style option trader would be likely to see more and more put option strikes in existing portfolio reaching the points of 30% ITM probability. At this time, it would be logic to assume that the trader would like to further roll out the rest of the put options in the portfolio. A review of the option chains of July (70 DTE), August (105 DTE), September (133 DTE), September Quarterly (147 DTE) could give us some clues as well. The September put options of around 5% ITM probability were heavily traded as shown in Figure 10: SPX September Option Chain on May 6, 2010. The September Quarterly puts were thinly traded with the open interests under 100. So it did not look like Karen used this option cycle on that day.
Therefore, let’s take a deeper look at the September option chain to understand what kinds of trade adjustments could be done in this type market crashes...

Wednesday, February 26, 2014

A summary of Karen, the super trader's option selling strategy in 2013

More than one year ago, I was intrigued by the Interviews on Karen, the supertrader and posted an outline of her strategy discussed in the video. Since then, there were many reader comments. So I studied the portfolio margin that she used to achieve high return on margin, and wrote a few other posts related to the strategy. Besides, I also started working on back-testing Karen's strategy and set up a Karen Study Group.

On Feb 11, 2014, Karen was interviewed by Tasty Trade again to provide an update of her trading in 2013 and some of her general trading guidelines. Here, I'd like to share my understanding from the interview on this naked option selling strategy. Please note Karen will adapt her strategy according to market conditions such as the volatility VIX. She highly recommended traders to come up with strategies that work for themselves.


2013 Fund Performances & Goal
  • Two funds totaling 196 Million USD, yearly return after expense
    • 27%, 24% (over 50M USD profits)
  • No losing month on 2013 (13 straight months, incl. Jan 2014)
    • Close out every month. No rolling out to the next month, closed current month positions.
  • Goal
    • At least to beat SPX gains yearly (but there were no specifics discussed on what rules were used to ensure beating SPX)

Strategy of Selling Naked Options
  • A strategy to profit on Theta (time decay) and volatility
  • Rules may be changed depending on market trend and volatility
  • Sell calls or puts independently
    • Never sell options as spreads (i.e. strangles)
  • Sell more puts depending on market trends
    • In 2013, maxed out on the put side to sell twice as many puts as calls
  • Sell calls with greater risks as market does not crash up
    • In 2013, stayed light on call side to sell calls with shorter period of time
  • The variable ratio of put to call contract sizes allows the strategy to adapt to market trend
    • In 2013, the 2 to 1 put to call ratio kept the portfolio Delta from negative
    • Most premium selling option portfolio have negative Delta (but not Karen's)

Trading Vehicles
  • Traded SPX options mainly, used options of SPX e-mini futures /ES sometimes
  • Main reason not trading SPY is commission costs, plus tax advantage 1256.
  • No problems with SPX option liquidity
  • Can potentially go to RUT if need other positions to put on
  • Disciplined to avoid trading individual stocks even though they have high volatility

Option Strike Price Selection

Sell far out-of-the-money, high probability options depending on market volatility
  • In 2011 & 2012 when volatility was higher (VIX >= 15), sold puts with 2 SD (5% ITM Probability)
  • In 2013 when volatility was low (VIX around 11 to 13), sold puts with 1 SD (15% ITM Probability) to 1.5 SD (7% ITM Probability)
  • Sell calls with 10% ITM probability

Option Cycle Selection
  • 14 days to expiration for calls in general for 2013
  • 56 days to expiration for calls if price can be projected and good premium can be obtained from far above the projected price
    • Use trend analysis including 2 SD Bollinger bands, resistance, and FIB retracements
  • 56 days to expiration for puts

Trade Entry (Always legging in trades)
  • Sell calls when market rises
  • Sell puts when market falls
    • In 2013, sold more puts when VIX jumped
  • Trades are entered in multiple days around predetermined option expiration days

Trade Exits
  • Actively take profits and risks off the table
  • For options (puts) starting around 56 DTE
    • Close positions if profits reach 50% within 1st 16 days
    • Leave positions on after the 40 DTE neighborhood if they are not closed yet so that they can expire worthless
  • For options (calls) starting around 14 days
    • Close positions if profits reach 20% to 30% or even better 50% in a few days
    • If price continues to rise with 1 week left for call options, then take the calls away and move them to next week while keeping puts on
  • After some point of time, may stop pulling back profits since a built-in profit is realized already.
    • Leave remaining positions of current month alone and start working on next month.

Trade Adjustments
  • When ITM probability is less than 30%, no adjustment is required.
  • When price drops and ITM prob becomes 30% (an arbitrary number) or greater for puts with plenty of days left (> 30 day)
    • Adjust the position by taking it off and sell other far OTM puts about 20% ITM prob cautiously
      • Some puts may be sold 10 points lower in ITM proba and others sold 15 points lower in ITM prob
    • It may be pushed out to another week for puts (Not another month)
      • Try to fix it in current week if possible
    • It may lose one or a few dollars
      • Try to make up the loss either through selling more put or call contracts
    • Will keep existing calls as their value decrease and let them expire worthless
    • Do not use existing calls as adjustments to the losses on the puts
      • It avoids risks due to sudden market direction reversals
  • Don’t have any option ITM!

Money and Risk Management
  • The most important part of the trading game
  • Use portfolio margin and further stress test potential loses
  • Unlimited risk in theory
  • Use TOS Analyzer Tab for risk evaluations
    • The daily portfolio P&L numbers derived at 10% up and 12% down of the market price must not exceed net liquidation value in normal cases
    • Portfolio P&L losses at the crash price must not exceed net liq
      • In 2013, crash price = (current price – 100) x 88%
        • The extra cushion is added due to low volatility (11, 12 to 14)
      • In 2011, crash price = (current price – 200) x 88%
        • The less cushion due to higher volatility
    • Managing risk at this crash point assuming the portfolio had a major loss already
  • If net liq drops due to adverse market conditions, the unrealized positions are losing money but they are considered safe if they have not reached adjustment points
  • In worst cases, may buy some low valued puts or calls to offset the push from market move
    • But this is not very often
    • Don’t care or fear as long as the positions are safe
    • Do not over-manage positions

Psychology and Mindset
  • Control the emotions of both fear and greed
  • Trust statistics and high probability (Use 2 SD for 95% odds of success)
  • Use structured method and manage positions well
  • Require a high level of confidence and repeatable successes for a long time.

Team Members
  • 7 members: 6 traders and 1 controller
  • Encourage other traders to set up of trading team for additional ideas


Saturday, February 1, 2014

Estimating In-The-Money Probability using IV and Standard Deviation

I've studied stock (and VIX)'s implied volatility changes with time before. It was based on the book by Dan Passarelli: Trading Option Greeks. This is a great book about Option Greeks and volatility. My post on the Effect of Prices, Time, Volatility on Option Greeks was also based on this book. It's these types of studies that lead me to the understanding of estimation of ITM probability of stocks.


Recently, I also researched for methods to calculate the ITM probability of options since the supertrader Karen uses it in her naked option selling strategy. If we find a formula to estimate the ITM probability, we can implement it in ThinkScript in our backtests of the supertrader's strategy.

ITM Probability Estimation Using Standard Deviation

Due to lack of ITM probability data in ThinkScript, the ITM probability can be estimated using the standard deviation of a normal distribution as shown below, according to http://en.wikipedia.org/wiki/Standard_deviation.


ITM Probability
SD Multiples
0.27%
3
4.55%
2
5%
1.960  
10%
1.645  
20%
1.282
30%
1.050  
31.73%
1

Stock Price Strikes/Points for Corresponding ITM Probability

In a recent TastyTrade video, the relationship between stock price changes and SD, IV, expiration days is presented in a formula:
Stock Price Change Percentage = SD Multiple x IV / Square Root of (365/DTE).

Putting all the pieces of the above information together, we should be able to estimate the stock prices for any ITM probability:
Stock Price of a certain ITM Probability = Current Price x ( 1 + Stock Price Change Percentage)

It means we can calculate the call/put selling strikes and adjustment points using the above formula for Karen's strategy. Since all of these parameters are available in TOS software, it's possible for us to implement in TS. I'll update it once I get a chance to code it. We should be able to present these prices in stock price charts to provide good visual display as well.

Update

Based on Vince's comment below, I have updated the above table which included probability on both sides. For the strategy of selling naked options, the single sided probability should be used. Therefore, the following table is the right one.
ITM Probability
SD Multiples
0.13%  
3
2.28% 
2
2.50% 
1.960
5%      
1.645   (Sold put strike) 
10%    
1.282   (Sold call strike)
15%    
1.050
15.87% 
1
30%
0.52     (Adjustment point)
Vince also kindly shared the following web site that gives us the SD multiple (Z) in a graphical representation: http://www.mathsisfun.com/data/standard-normal-distribution-table.html. In this dynamic graph, you can select "Up to Z" button at top left side first, and move curve to a probability value of interests, then read the SD multiple (Z).

Saturday, January 25, 2014

Super Trader Karen Study Group

The successful story of super trader Karen has captured attention and imagination of many option traders. Some readers are looking for ways to communicate with each other about the strategy. They left great comments or contacted me via email in the last year or so since my original post. Encouraged by the enthusiasm, I finally created a Yahoo Group to help option traders who are interested in studying this strategy. I certainly expect to learn a lot of insights from fellow option traders as well, as I have seen some members stating great success in the last few years selling options or managing million dollar account.

This is a restricted user group focusing on the study of selling naked options, the Karen way. Main topics that I can think of right now include the following:

  • Discussions on super-trader Karen's strategy
  • Back-testing the option premium selling strategy
  • Trading (paper or real) the strategy
  • Other related topics

The strategy requires intermediate and advanced understanding of option trades, such as implied volatility, probability, option Greeks. So it's only good for people with the proper level of knowledge and experience. I'd like to make the posted messages available to the public even though only the members can post. But for some reason, the Yahoo group web site grey'ed out the option of Non Members can view messages section. If I figure out how to enable this option in the future, then the public could read the group messages.

In the past 3 weeks since the inception of the group, we have over 30 members joined which is beyond my expectation. Members seem to be from different countries, include USA, Canada, Italy, India, Singapore, etc. If you think you have the right skill and like to contribute, welcome to join this dynamic community.

Saturday, November 16, 2013

Skeptical about super trader Karen's strategy and performance?

Since I posted about Super trader Karen's option selling strategy, I have received a couple of anonymous comments questioning about her strategy and trading performance. Other on-line trading forums have a lot more critics of the trading performance of Karen, the super trader. So I'd like to share my 2 cents as well. Please note I'm not affiliated with Tom or Karen. They don't know me at all, at this time of my writing.

I was educated by Investools (same stock/option education company that Karen attended) and by TOS (founded by Tom) in option trading. I happened to attend a few seminars presented by Tom, the interviewer of the Karen. Thus, I believe Tom is a successful and honest businessman. So it's hard for me to believe he would lie about his client (Karen) in TOS. In my humble opinion, there is no dispute among option traders that selling option premium is the most consistent way to profit on stock option trades. Karen's option selling strategy appears to be sound and logical for me. [Update: I'd like to stress that the system and the rules disclosed in the interviews should be far more important than the phenomenal profits for traders who are process-focused.]

A lot of people know solid option trading strategies as they are taught by many education experts but only very few limited numbers of them actually make money for living using these strategies. I think Karen is one of the successful option traders who made millions of dollars. Her trading performance in the time frame discussed in the interview video was exceptional, as Tom stated in the interview repeatedly. It's so exceptional that Tom and other option education experts could not achieve. It also means all other traders are not likely to achieve unless they become really exceptional too. Exceptional also suggests the excellent performance may not last forever. Since Karen's strategy involves probability, I believe it's possible to calculate the expected rate of return in estimation. Anyone who can keep the rate of return should be considered as a successful trader of this strategy. This should be the target many of us trying to reach.

To make a good judgement about this option strategy and its potential performance, traders must understand its principles first. Many of the critics online do not provide enough substances in their comments. But I still like any critics about the strategy itself and its published rules. Otherwise, I suggest to put accusations in other on-line forums.

Saturday, March 16, 2013

Super trader Karen's portfolio margin

Although I don't emulate to trade Karen's strategy at the moment, some reader's comments were interesting. One comment about the Return on Margin (ROM) reminded me of the portfolio margin. Newly available from 2007, the portfolio margin gives traders more flexibility to trade bigger sizes compared with old margin requirements based on "Reg-T". TOS is one of the brokers that support portfolio margin.

For SPX/SPY, the portfolio margin fits into the following category: Large cap broad-based indices are tested with a minimum +6%/-10% price changes. Using this criteria, the Karen strangle shown below would have a portfolio margin of $3838 vs Reg-T margin of $25,283. What a difference! It bumps up the ROM dramatically, even if the minimum price changes are set as 10% to upside and -15% to the downside.
Portfolio margin is available for margin accounts (not IRA) of $125K and above only. A broker can increase its own portfolio margin requirements based on a number of criteria. I believe Karen had complained about a sudden (No advanced Notification) margin requirement change by TOS which resulted her largest loss ever. This margin requirement change she mentioned was very likely to be related to portfolio margin "minimum" stress test I believe.

Without the PM, the naked call determines the margin ($25K) for this type of strangle. The naked put has much less margin requirement ($13.5K).

Saturday, March 2, 2013

A Simple Review of Margin Requirement and Theta of the Karen-Super-Trader Strangle

There were some discussions on Karen (the Super trader)'s strategy about its ROM & Theta decay on average. To answer a reader's question, I spent a little time to analyze a regular strangle on TOS. With 47 days to expiration for April, the strange receives a credit of $5.25 as shown in the chart below. Somehow, the probability of expiration ITM shown in the chart is shown close to 20% on the upside. It contradicts the probability indicated at the trade page on TOS.
The Theta is about 70. I think it's close to the average $80 range as another commentator indicated, considering are many more days for Theta decay. I tried to analyze Theta decay in the analyzer but the analyzer chart showed some weird curves that I don't understand. So I have to ignore it for now.

The margin requirement for a margin paper account was real big. With the 10% probability ITM call and 5% probability ITM put strangle, the margin was a little over $24K I believe. So for a $100K margin account, we can sell 2 such SPX strangles with a margin requirement of about $50K. This is the initial capital used for opening positions. If an adjustment is made by selling another option, the margin will be around $75K, reaching the limit mentioned in the original interview. I think if SPY is used, the contract size will be that of the SPX times 10. Thus, SPY will offer more flexibility for capital usage for a $100K account.

In the IRA paper account, the margin field is illegal + 300 shares. I'm not sure what it means though.