
Thursday, May 28, 2015
Sold IWM July $117/112 bull put spread
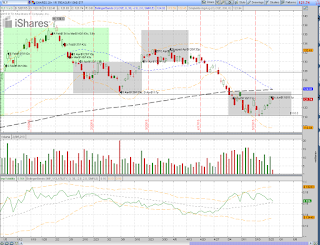
Market dropped less than half of yesterday’s big rise. Since my overall stance on market is slightly bullish, I decided to take the opportunity to sell IWM bull put spreads if the put options look appealing. My next levels of support of IWM, along with its uptrend lines are shown in the image below as $122.5, $120.5, $118.5. The July short strike $117 of 50DTE has a delta of 0.19 which fits my short option selection criteria and it’s below multiple support levels. Thus, I sold July$117/112p vertical spread for $0.54 which also met my 10% return requirement. With 2 positions open, I still have power to enter another one for the portfolio.

Wednesday, May 27, 2015
Exited June$116/111p TLT position with a targeted profit
Yesterday, TLT finally rallied back to the entry price level and a bit higher, after 3 weeks of entry and with 24 DTE. Its IV also dropped a bit. Since my bull put June$116/111p position was against TLT downtrend, my profit target was 50% of max potential. So I set a closing order for $30 around 9:00 AM PDT yesterday as my entry credit was $0.60. It got filled in about one or two hours later. The TLT trade went against me immediately after the entry but was never seriously endangered as it did not touch short strike $116 at all. The 50% of max potential profit in 3 weeks worked perfectly for the strategy.
 Now I have one XLE bull put position open and two potential positions to be opened for this portfolio. Looking at the other 5 remaining ETF candidates, I don’t feel they are at any turning boundaries yet. So I’ll wait for new opportunities to come.

Thursday, May 21, 2015
Sold July$76/71 bull put spread on XLE
Of the 6 ETF candidates, SPY was at the top Bollinger bands. Since the bear call spread was against the trend, I decided waiting a bit more time for SPY trade. XLE had rebound in the last couple of days from lower Bollinger bands. I liked the bull put spreads which were following the slight uptrend for XLE since 4 months ago. The July short strike $76p of Delta 0.22 was above the low channel line acting a support and offered the July$76/71p spread a credit of $0.55, with 57 DTE. So I sold this vertical as my 2nd position in the portfolio. I still have enough margin for a 3rd position.


Wednesday, May 20, 2015
Exit of IWM June$114/109 bull put spread with a profit
In about 3 weeks after entry of Jun$114/109p, IWM pulled back to a high level to give the position a major profit. With 30 DTE, I decided to exit according to the trading plan and it would give me additional power for new opportunities. With IWM at $124.87, the cost to close the position was about $0.12. Since the entry credit was $0.52, the profit percentage was 76% of max potential profit. Now, I have opened more funds for two positions.

Among all of my 6 trading ETF’s, XLE had touched the lower Bollinger bands. A bull put spread seemed to align with XLE uptrend in the last few months. The trending conforming spread was what I needed for the portfolio for now. So I entered an order to sell July$74/69p vertical for $0.50 with 58 DTE. The next major support appeared to be around $74, the short strike with a Delta of 0.19 as well. However, the order was not filled today.

Among all of my 6 trading ETF’s, XLE had touched the lower Bollinger bands. A bull put spread seemed to align with XLE uptrend in the last few months. The trending conforming spread was what I needed for the portfolio for now. So I entered an order to sell July$74/69p vertical for $0.50 with 58 DTE. The next major support appeared to be around $74, the short strike with a Delta of 0.19 as well. However, the order was not filled today.
Thursday, May 7, 2015
Exited XLE Jun$87/92 bear call with a profit
XLE refused to drop for more than 2 weeks after my bear call spreads June$87/92c were entered on 4-17. But due to market pressure, XLE made significant drops in the last 3 days. With 43 DTE, I was able to get out for $0.21 to obtain a profit of $0.33 (.54-.21, 61%) when XLE was trading around $80.5. Market offered me an higher return for this trade than my average expectation of 50%.
Looking at the chart, XLE has made a higher low 6 weeks ago and higher high a few days ago. So it seems to show an uptrend now. I may enter bullish put spreads if I have the opportunity in the future. Now I have fund available for another new position. I’ll look for a new trade after I come back from vacation in about 1 week.
 Separately, I noticed TOS chart might have an issue. The 200 DMA was above the last swing high in this chart. But there are two other chart software, i.e. StockCharts.com and ProphetCharts from TOS that indicated the last swing high touched 200 DMA. So the spike in the TOS chart for the IV may be erroneous as well.
Looking at the chart, XLE has made a higher low 6 weeks ago and higher high a few days ago. So it seems to show an uptrend now. I may enter bullish put spreads if I have the opportunity in the future. Now I have fund available for another new position. I’ll look for a new trade after I come back from vacation in about 1 week.

Wednesday, May 6, 2015
Sold June $116/111 put vertical spreads on TLT
Yesterday, TLT finally dropped to the 6 month support level around $122 that I had been waiting for. So I sold TLT Jun$116/111p vertical spreads with the short strike Delta of 0.20 as planned for a credit of $0.60 and 45 DTE. TLT was trading around 121.9, which was a bit below the lower Bollinger band. The next major level of support I saw was around $118. Since it was above the short put strike, I think chances of success are good enough for the trade. Now I have used all the trading power for the monthly cycle and will spend time manage these three positions.

Subscribe to:
Comments (Atom)