Pages

Friday, May 26, 2017

Adjustments of Diagonal Spreads to Meet New Market Outlook

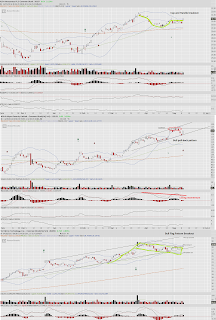
Yesterday, the stock market delivered the 6th consecutive rises, accompanied by higher volume. It also broke prior high to signal the resumption of the powerful uptrend.

Both QQQ & SPY showed their 2 month long uptrend channel lines, after a confirmation by rallying from the lower channel line 6 days ago. If the momentum is strong, I think the market indices will grind higher along the upper trending channel line as shown below, with some minor pullbacks along the way.

After hedging positions with short calls on the scare of presidential impeachmentsell-off 7 trading days ago as described in a previous post, the stock market started rising gradually, with declining volume for 5 days.  Therefore, I did not uncover the short calls until the market’s rise with higher volume yesterday.

Typically, market would pullback after 8 days for consecutive rises. On the 6th day of the continuous rise, I decided to roll up and out the short calls for most of my diagonal call spread positions expiring from June 9 to June 16. The new short call options have 22 days to expiration and Delta around 0.25 as usual.

Due to the large price hikes, the diagonal spread positions were on the border of Delta inversion before the rolling. It meant overall diagonal position could not profit even though there were good amount of price increases at the inversion day. 

The new positions are summarized below for reference.
Stocks
Existing Calls
New Short Calls
Notes
Jun9 $162.5; $1.63
Bought back for $4.20
Left naked call Sept15 $145 as it broke out $161 resistance with high volume
Jun9 $42; $0.27

No change as it approached resistance level 41.7 without stronger relative strength
Jun9 $30.5; $0.34

No change as it approached resistance level $29.5
Jun9 $239.5; $1.22
Jun16 $244.5; Rolling deficit of $2.43
Used short call with the expectation of a pullback after a 6 day rise in a roll
Jun9 $139; $0.83
Jun16 $143; Rolling deficit of $2.04
Used short call with the expectation of a pullback after a 6 day rise in a roll


The trading plan is to uncover the diagonal spread if the market tries to pull back and rally from there again. If market continues to grind up, I’ll continue to roll up and out for the diagonal spread.

Sunday, May 21, 2017

Simple Hedging Strategies for Market under Pressure

On Wednesday of last week, we saw market stumbled with huge volume due to fears about possible presidential impeachment. It created technical damages to the SPX chart as shown below, even after a subsequent 2 day rally.
  1. SPX price went back to $2400 ~ $2330 range
  2. SPX 50 day moving average seemed to move sideways
  3. 4 distribution days accounted in the last few weeks
  4. Momentum indicator MACD turned
  5. Cyclical indicator Stochastics turned below 80

If SPX falls below 2352 in the next few days and register more distribution days, it would require more hedging actions. The simple strategy to use is to sell and/or roll down short call options and minimize weak positions to reduce portfolio risks. Since I have short calls already sold last Wed., I’ll roll down some of the call options in such an event.

In the meantime, if the accumulative new highs – new lows index of NASDAQ & NYSE also shows a top, I would consider the market outlook as going to correction for a couple of months at least. I would continue to reduce positions, as I had already sold the weakest performer (PVH) in my portfolio.

In general, the accumulative new highs – new lows indicators of stock market on NASDAQ and NYSE exchange are effective indicators to signal intermediate and long term market tops.  They usually do not turn down in short term pullbacks.  Therefore, they can be used as a type of filter to market fluctuation noises in the short or near terms to help intermediate and long term traders to maintain bullish positions. If there is at least one of these indicators (on ether NASDAQ or NYSE) trending up, then the market is likely not to go to a correction phase yet. However, this type of indicators may lag other indicators where rapid sell-off occurs during market tops, particularly in climax selloffs.

There is also a possibility that the market will continue to rise. I’ll be convinced of the resumption of the market up-trend if SPX tries to fall then recover to show a bullish candlestick pattern along with improving indicators in the SPX chart. If market grinds higher, I may roll up my short call option strikes to allow me to gain mild profits.

Wednesday, May 17, 2017

Hedging Bullish Positions to Reduce Portfolio Risks as Market Plunges

The stock market sold off today after $SPX could not break above the 2400 level in the last 2.5 months while $VIX dropped to historical low level for a couple of weeks. In about half a day, SPX erased all the gains after the French electionresult day as describe in my post and fell below 50 day moving average with huge volume.

While the headline news was political concerns about US president, the technical analysis of the market trend did signal a major weakness of the market. All of the stocks discussed in my blog expressed signs of weakness as well.

So, I hedged all long positions with short calls at Wall Street noon time with the exception of EPI which does not have sufficient option liquidity. The short calls had Delta from 0.28 to 0.35, with In-The-Money expiration probability around 30%.

Here’s the list of short calls for the recent long stock call options.

Stock
Short Calls
Prices
Notes
NFLX
June 9 $162.5
$1.63

EEM
June 9 $42
$0.27

PVH
September 15 $95
$8.60
Closed position
MU
June 9 $30.5
$0.34
Sold 2 days ago

At the time when I was trading, PVH was trading below its 50 day moving average but above my stop loss point $97.79 (as described in my post Trading chart pattern from a bull flag turning to a high base with diagonal spread) after bouncing back from below it. Since it was the weakest stock in my portfolio, I just sold the September 15 $95 Call to close the position for $8.60 (close to middle price) which got filled immediately. As with other stocks, it resumed plunging after Wall Street’s lunch time and it broke below my stop loss point by the end of the day.

For MU which entered into a diagonal spread a couple of days ago, I did not roll down the short call on MU since the option price did not reach 1/3rd of the initial premium at the time.

Another better hot stock NFLX had a good advance, but seemed to pull back in the last few days. It fell 2% when I sold its June 09 call at strike $162.5.
Overall, it was a busy day for me as a part time trader, since it took me about 1 hour to complete all the trades. I also hedged my longer term bullish positions on SPY & QQQ call options with short calls. These positions were entered before the initial French Election result on April 24 and were not posted in the blog. I plan to provide some summary in the future about these longer term trades.

Tuesday, May 16, 2017

Hedging Call Option Risk by Selling Short Calls on MU

When upward momentum loses steam for stock price movement, the long call options face the dilemma of losing time value if the stock moves sideways or losing intrinsic value if the stock falls in the near term. If we believe the stock’s longer term uptrend is still valid, we can hedge the call option risk by selling short calls. The sold call option also helps to overcome the time decay of the option.
The downside of the hedge is the possibility of a surprise big surge of the stock price soon. It will cause the trade to gain less value than the original naked call position, since the short call option will cost more to be bought back. This is the cost of the hedge in this option strategy.

Today, the price of MU on which I have a naked long call position (Oct 20, $27 Call) expressed the first signs of its weakness. A few days ago, I bought the MU call option as MU broke out of a bullish flag chart pattern as posted in An Analysis of 3 Bullish Stock Chart Patterns. About 5 trading days later, MU had two days of price drops in a roll and looked going down today as well. Its MACD histogram also declined 2 days consecutively as shown in the chart below. These are the specified signals for me to hedge with short call option for such a position. As a semiconductor company, it also showed weaker relative performance against the SMH semiconductor ETF.

Therefore, I sold June 9 $30.5 call for a credit of $0.34 to leg into a diagonal call spread position on MU. As usual, I chose the option Delta to be greater or equal to 0.25. The OTM call Delta is the roughly the same as the probability of this option strike to expire ITM. So there is approximately 25% probability that MU will expire above $30.5 at this point. The new cost of the trade is reduced to $4.21 - $0.34 = $3.87.

As always, we need an action plan for the future in case the stock prices reverse its current course. If MU ends its short term pull-back and starts to rise strongly for at least one day, it means the stock is back to its up-trending pattern. Then, I’ll buy back the short call option.  This is what I had done for EEM as posted in EEM Diagonal call spread adjustment as emerging market outperforms. Otherwise, if the prices grind upward and the Delta reaches over 0.60, I'll roll out the short call.

There are many helpful free introductions to the basic concepts of diagonal call spreads. The one that I found with relatively complete descriptions on the characteristics of this strategy is at TheOptionsGuide.com:  Diagonal Bull Call Spread. It explains the following aspecs of the diagonal call spread:

  • Spread construction 
  • Profit potential 
  • Downside Risk 
  • Commissions 
  • Theoretical Example 
  • Similar Strategies 


Friday, May 12, 2017

Trading chart pattern from a bull flag turning to a high base with diagonal spread

Sometimes, stock chart patterns do not progress as expected. A bull flag pattern could fail and turn into bearish or flat patterns. With the diagonal spread option strategy, you can continue to benefit from the time decay of the sold option, as long as the stock does not break out of the consolidation range. The premium of the short option is able to cover some of the loss of the long option as a hedge. It may also generate eventual profit for the position if the stock prices stay in the range or move in favor of the long option later.

Here’s a live example of this type of trade. About 3 weeks ago, I started the bull flag breakout trade on PVH with the purchasing of September 15 $95 Call. Then PVH hit resistance level around $104.35 and started to pull back. I sold short May 19 $105 Call after the price dropped for about 2 days in a roll, as posted in 2 live examples of Legging into Diagonal Spreads.

Since then, PVH never rose for over 2 days in a roll which is my guideline to keep the short call (without uncovering it). Today, PVH which is an apparel hold company fell hard intraday along with other retail stocks, as they were sold off in the last couple of days after a couple of bad earning reports. The stock market is concerned about the future prospect of brick and mortar retailers against on-line shops.

After touching the 50 day moving average (DMA) and horizontal support which was a little bit above my mental stop at $97.79, PVH started to bounce up. The short call did meet two of my exit rules:
  • Delta reached below 0.10
  • Premium dropped over 80%
So, I placed a limit order to buy back the May 19 $105 Call for $0.16 to lock in 80% of its profit. It got filled after a couple of hours.  Now, the cost of the position is $12.22 - $1.00 + $0.16 = $11.22 + $0.16 = $11.38.

Since PVH has its 50 DMA up-trending, the general market is still bullish and PVH outperforms XRT at this moment, I decided to hold the long call for now. The next actions will be based on my plan as follows:
  • Exit the long call if the stock price continue to show weakness and breaks below 50 DMA or my mental stop loss point
  • Sell another call if the stock price rises, then pulls down for another 2 days in a roll with a declining MACD histogram
We’ll never know the outcome of the trade before the market finally shows it real face as it evolves. At present I think there is still a high probability for this trade to profit and I’m enjoying the diagonal spread trade until proven otherwise.

Tuesday, May 9, 2017

An Analysis of 3 Bullish Stock Chart Patterns

When stock market is bullish, there usually are a good amount of stocks that exhibit bullish chart patterns. Quite often, we have to choose one or two best stocks to trade out of many stock charts at a given day. This is exactly what happened to me today.

My bullish portfolio allowed me to take one more bullish position. So I ran my bullish search scripts in the last few days and could not find any chart patterns that were interesting to me. One of the possible reason might be my search criteria requires estimated daily volume greater than 150% of 20 day average trading volume. But this morning I found more than 3 stocks that showed bullish chart patterns and active trading volumes.  I was interested in the following 3 stocks mainly:
  • AZN (A pharmaceutical company) with a cup and handle pattern;
  • WYNN (Hotel) with a bull pull back pattern;
  • MU (Semiconductor Company) with a bull flag pattern.
The stock chart patterns are drawn for illustration purpose in the image below.  Note the volume shown was intraday volume around noon time. The final volume was projected to be twice as much based on my rudimentary algorithm.

I liked the 6 week cup and handle pattern of AZN. But I found its option liquidity was an issue for me since the bid & ask prices for out of the money (OTM) call strike at Delta around 0.3 were over 20%. I decided to skip this option trade since my short call usually use this type of strike if I need to leg into a diagonal spread.

WYNN was bouncing up from both horizontal and up-trending support lines. But I saw a negative divergence in its MACD line. It suggested slower momentum for WYNN since the distance between the recent highs were shorter than that of the prior one. The stock also formed some level of over-head resistance in the prior two weeks. These were not desirable bullish signs.

Therefore, I settled on the 10-week long bull flag chart pattern on MU, which had very good option liquidity as well. I bought October 20 $27 Call for $4.21 as a position trade. The mental stop loss was set to $26.28 which was slightly below the last low in more than 3 weeks. My target price was $33.98 according to my trading spreadsheet. I plan to leg into diagonal spreads when the stock shows weakness (2 days in a roll with declining MACD & price).

In summary, here is the outline of my stock option trading selection steps. Hopefully, this multi-step procedure is not a stock analysis paralysis.
  1. Verify recognizable price chart pattern that you plan to trade
  2. Verify option bid & ask price spreads to be less than 20%
  3. Review momentum of the prices (i.e. MACD indictor)
  4. Verify bullish trading volume
  5. Look for good relative strength
  6. Look for bullish sector behavior

Did I make the right choice among multiple stock patterns? I used to have some concerns about the right pick or not. After year’s trading activities and the application of the principles of trading psychology as posted before (Additional thoughts on the successful mindset for high probability traders), I’m much more comfortable to face this uncertainty now. By following a solid trading process, I felt the profit probability is high although it’s not a certainty. My blog readers may have other thoughts. Please share with me if any.

Sunday, May 7, 2017

Recent History of Election's Impacts on the US Stock Market

As traders, we are interested in the short term impacts on the stock market by major elections. Will tomorrow's French presidential election impact the US stock market again? Based on my study below, the Wall Street is telling us: No, as the VIX is at very low level, which is quite different from that on the day before the initial French election result about 3 weeks ago.

As part of the study on major election impacts on the US stock market, I looked at the prices of both SPX and VIX in the past year as shown in the chart below.
SPX & VIX's Reactions to Major Elections

  • More than 50% of time when VIX reached 16.5 and above were due to pending elections
    • British EU Exit (Brexit)
    • US Presidential Election
    • French Presidential Election (Initial)
  • VIX created negative divergences when foreign elections were pending
    • SPX price does not fall deeper but the fear on the stock market (VIX) increases to higher level
      • The negative divergence suggests over-abundance of fear
      • It's usually bullish for stock market

These are my observations only. What are your findings as a seasoned trader?  For the long history of how stock market reacts to US presidential elections, I found the following article very helpful: How the stock market performs on, and after, Election Day on MarketWatch.com.

Since traders need to prepare for major events before they occur, we are interested in FED announcements as well. I had studied the impacts of FED announcement on stock market before in my post: A Study of Market Moves, VIX and FED meetingsI plan to update and review the recent impacts of FED announcements in the future when I get a chance.

Tuesday, May 2, 2017

EEM Diagonal call spread adjustment as emerging market outporforms

Just 2 days after legging into a diagonal call spread on EEM, it invalidated the possible pullback sign and outperformed the general market SPY by rising for about 3 days. It looks like EEM will behave like other strong stocks that will advance for about 3 or more days and fall only 1 to 2 days at this time.

My diagonal spread short call adjustment rule dictates that if the stock has good rises and relative strength, the short call used for hedging possible weakness should be uncovered to leave the long call uncovered (naked).

Therefore, I exited the short call June 2 $41 by buying it back for $0.39. Now, the new cost of the position is $3.15 + $0.39 = $3.54. For the record, the entry cost was $3.39 and the hedge cost = $0.39 - $0.24 = $0.15 for the moment. My last trade on this position was posted here.
Looking at my other bullish positions entered shortly after the initial French election result 1 week ago, they are performing just fine. NFLX performed the best as of today since it had a good pop up yesterday. PVH continues to move in sync with XRT and is still in expected trading range. The Indian ETF EPI also outperforms S & P 500 in the last few days.