When stock market is bullish, there usually are a good
amount of stocks that exhibit bullish chart patterns. Quite often, we have to
choose one or two best stocks to trade out of many stock charts at a given day. This
is exactly what happened to me today.
My bullish portfolio allowed me to take one more bullish
position. So I ran my bullish search scripts in the last few days and could not
find any chart patterns that were interesting to me. One of the possible reason
might be my search criteria requires estimated daily volume greater than 150%
of 20 day average trading volume. But this morning I found more than 3 stocks
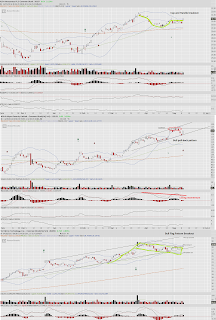
that showed bullish chart patterns and active trading volumes. I was interested in the following 3 stocks
mainly:
- AZN (A pharmaceutical company) with a cup and handle pattern;
- WYNN (Hotel) with a bull pull back pattern;
- MU (Semiconductor Company) with a bull flag pattern.
The stock chart patterns are drawn for illustration purpose
in the image below. Note the volume
shown was intraday volume around noon time. The final volume was projected to
be twice as much based on my rudimentary algorithm.
I liked the 6 week cup and handle pattern of AZN. But I
found its option liquidity was an issue for me since the bid & ask prices
for out of the money (OTM) call strike at Delta around 0.3 were over 20%. I
decided to skip this option trade since my short call usually use this type of
strike if I need to leg into a diagonal spread.
WYNN was bouncing up from both horizontal and up-trending
support lines. But I saw a negative divergence in its MACD line. It suggested
slower momentum for WYNN since the distance between the recent highs were
shorter than that of the prior one. The stock also formed some level of
over-head resistance in the prior two weeks. These were not desirable bullish
signs.
Therefore, I settled on the 10-week long bull flag chart
pattern on MU, which had very good option liquidity as well. I bought October
20 $27 Call for $4.21 as a position trade. The mental stop loss was set to
$26.28 which was slightly below the last low in more than 3 weeks. My target
price was $33.98 according to my trading spreadsheet. I plan to leg into
diagonal spreads when the stock shows weakness (2 days in a roll with declining
MACD & price).
In summary, here is the outline of my stock option trading selection
steps. Hopefully, this multi-step procedure is not a stock analysis paralysis.
- Verify recognizable price chart pattern that you plan to trade
- Verify option bid & ask price spreads to be less than 20%
- Review momentum of the prices (i.e. MACD indictor)
- Verify bullish trading volume
- Look for good relative strength
- Look for bullish sector behavior
Did I make the right choice among multiple stock patterns?
I used to have some concerns about the right pick or not. After year’s trading
activities and the application of the principles of trading psychology as
posted before (Additional thoughts on the successful mindset for high
probability traders), I’m much more comfortable to face this uncertainty now. By
following a solid trading process, I felt the profit probability is high
although it’s not a certainty. My blog readers may have other thoughts. Please
share with me if any.

No comments:
Post a Comment