
Thursday, May 28, 2015
Sold IWM July $117/112 bull put spread
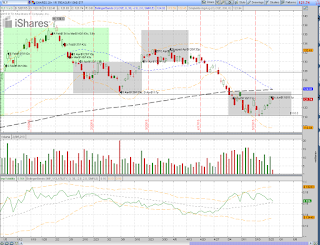
Market dropped less than half of yesterday’s big rise. Since my overall stance on market is slightly bullish, I decided to take the opportunity to sell IWM bull put spreads if the put options look appealing. My next levels of support of IWM, along with its uptrend lines are shown in the image below as $122.5, $120.5, $118.5. The July short strike $117 of 50DTE has a delta of 0.19 which fits my short option selection criteria and it’s below multiple support levels. Thus, I sold July$117/112p vertical spread for $0.54 which also met my 10% return requirement. With 2 positions open, I still have power to enter another one for the portfolio.


Wednesday, May 27, 2015
Exited June$116/111p TLT position with a targeted profit
Yesterday, TLT finally rallied back to the entry price level and a bit higher, after 3 weeks of entry and with 24 DTE. Its IV also dropped a bit. Since my bull put June$116/111p position was against TLT downtrend, my profit target was 50% of max potential. So I set a closing order for $30 around 9:00 AM PDT yesterday as my entry credit was $0.60. It got filled in about one or two hours later. The TLT trade went against me immediately after the entry but was never seriously endangered as it did not touch short strike $116 at all. The 50% of max potential profit in 3 weeks worked perfectly for the strategy.
 Now I have one XLE bull put position open and two potential positions to be opened for this portfolio. Looking at the other 5 remaining ETF candidates, I don’t feel they are at any turning boundaries yet. So I’ll wait for new opportunities to come.

Thursday, May 21, 2015
Sold July$76/71 bull put spread on XLE
Of the 6 ETF candidates, SPY was at the top Bollinger bands. Since the bear call spread was against the trend, I decided waiting a bit more time for SPY trade. XLE had rebound in the last couple of days from lower Bollinger bands. I liked the bull put spreads which were following the slight uptrend for XLE since 4 months ago. The July short strike $76p of Delta 0.22 was above the low channel line acting a support and offered the July$76/71p spread a credit of $0.55, with 57 DTE. So I sold this vertical as my 2nd position in the portfolio. I still have enough margin for a 3rd position.


Wednesday, May 20, 2015
Exit of IWM June$114/109 bull put spread with a profit
In about 3 weeks after entry of Jun$114/109p, IWM pulled back to a high level to give the position a major profit. With 30 DTE, I decided to exit according to the trading plan and it would give me additional power for new opportunities. With IWM at $124.87, the cost to close the position was about $0.12. Since the entry credit was $0.52, the profit percentage was 76% of max potential profit. Now, I have opened more funds for two positions.

Among all of my 6 trading ETF’s, XLE had touched the lower Bollinger bands. A bull put spread seemed to align with XLE uptrend in the last few months. The trending conforming spread was what I needed for the portfolio for now. So I entered an order to sell July$74/69p vertical for $0.50 with 58 DTE. The next major support appeared to be around $74, the short strike with a Delta of 0.19 as well. However, the order was not filled today.

Among all of my 6 trading ETF’s, XLE had touched the lower Bollinger bands. A bull put spread seemed to align with XLE uptrend in the last few months. The trending conforming spread was what I needed for the portfolio for now. So I entered an order to sell July$74/69p vertical for $0.50 with 58 DTE. The next major support appeared to be around $74, the short strike with a Delta of 0.19 as well. However, the order was not filled today.
Thursday, May 7, 2015
Exited XLE Jun$87/92 bear call with a profit
XLE refused to drop for more than 2 weeks after my bear call spreads June$87/92c were entered on 4-17. But due to market pressure, XLE made significant drops in the last 3 days. With 43 DTE, I was able to get out for $0.21 to obtain a profit of $0.33 (.54-.21, 61%) when XLE was trading around $80.5. Market offered me an higher return for this trade than my average expectation of 50%.
Looking at the chart, XLE has made a higher low 6 weeks ago and higher high a few days ago. So it seems to show an uptrend now. I may enter bullish put spreads if I have the opportunity in the future. Now I have fund available for another new position. I’ll look for a new trade after I come back from vacation in about 1 week.
 Separately, I noticed TOS chart might have an issue. The 200 DMA was above the last swing high in this chart. But there are two other chart software, i.e. StockCharts.com and ProphetCharts from TOS that indicated the last swing high touched 200 DMA. So the spike in the TOS chart for the IV may be erroneous as well.
Looking at the chart, XLE has made a higher low 6 weeks ago and higher high a few days ago. So it seems to show an uptrend now. I may enter bullish put spreads if I have the opportunity in the future. Now I have fund available for another new position. I’ll look for a new trade after I come back from vacation in about 1 week.

Wednesday, May 6, 2015
Sold June $116/111 put vertical spreads on TLT
Yesterday, TLT finally dropped to the 6 month support level around $122 that I had been waiting for. So I sold TLT Jun$116/111p vertical spreads with the short strike Delta of 0.20 as planned for a credit of $0.60 and 45 DTE. TLT was trading around 121.9, which was a bit below the lower Bollinger band. The next major level of support I saw was around $118. Since it was above the short put strike, I think chances of success are good enough for the trade. Now I have used all the trading power for the monthly cycle and will spend time manage these three positions.

Thursday, April 30, 2015
Sold IWM Jun$114/109 bull put spread
Market was falling
in the last couple of days. With the overall uptrend intact and 200 DMA going
up, I felt safe to enter a bull put spread on IWM Jun$114/109p for $0.52 credit
with 50 DTE. At this time, IWM dropped outside the Bollinger band and to a
prior low set 1 month ago. It seemed to rise after the touching. The short
strike was of Delta 0.19 area and the strike price was below a couple of major
resistance levels.
At this time, I
still have one more position to entry to reach my entry margin limit. TLT may
be close to its lower boundary now. I may sell some credits tomorrow if
possible. The XLE position has been flat
since its entry about 2 weeks ago, as XLE moved sideways to slightly up. Selling
another XLE bull put spread may be another option to benefit from its possible
rise.

Monday, April 20, 2015
Sold XLE Jun$87/92 bear call spreads last Friday
To keep better track of my strategy of selling verticals at the edges, I'd like to start posting my trades here to keep more accountability for myself and seek inputs from others as well.
With full fund available for opening trades for a new option cycle, I reviewed my ETF candidates for entry at the trading hours on Friday. XLE was closest to the upper Bollinger band, since it rose about $8 from recent trough of $74. It had fallen from around $82.87 to $81.87 in the last couple of days. The next levels of resistances on my chart are $85.50 by 200DMA and $89 to $90 area. I decided to sell Jun$87/92c for a credit of $0.54 with 63 DTE. The short strike had Delta of 0.21/ITM probability of 19.35%. I'll adjust if XLE short strike delta reaches 0.65 and above.

With full fund available for opening trades for a new option cycle, I reviewed my ETF candidates for entry at the trading hours on Friday. XLE was closest to the upper Bollinger band, since it rose about $8 from recent trough of $74. It had fallen from around $82.87 to $81.87 in the last couple of days. The next levels of resistances on my chart are $85.50 by 200DMA and $89 to $90 area. I decided to sell Jun$87/92c for a credit of $0.54 with 63 DTE. The short strike had Delta of 0.21/ITM probability of 19.35%. I'll adjust if XLE short strike delta reaches 0.65 and above.
Saturday, March 21, 2015
Overcoming weaknesses of trading personalities
I had studied the mind set of successful traders before. Recently, I've been reading a book named "Proven strategies for generating greater profits from the award-winning team at maverick trading" by Darren Fischer, et. al. This book covers a broad range of trading topics in about 300 pages, and gives an excellent introduction on how to become a professional trader.


Here, I'd like to focus my study on one of the chapters regarding how to overcome weaknesses of a trader's personality. In order to identify a trader's strength and weakness, the book presents a series of questions in the following 4 aspects to categorize trader's personality, depending on the answers of the reader:
As an example, the trader with the following set of personality has specific strength and weakness as shown in the table below.
The book gives some other insights beyond the typical baseline solution of imposing trading discipline: create specific trading rules and environments so that the weaknesses have minimal chances to show up in the trading process. This methodology, rather than trying to correct the weakness, should help to overcome the weaknesses since trader's personality is likely to remain over a long time in the trading career.
It's stated that the root cause of all weakness is the fear and greed. The only way to remove this element completely is not to care about profit and loss. Trade the amount that is totally comfortable for you if you face maximum loss. Personally, I think we can also avoid looking at the P&L all the time, by not showing the P&L in the trading software windows during trading battles.
For intuitive decision makers who like to look for evidence to support some trading biases, this type of traders needs to simplify the indicators to just one or two. For feelers whose trading action may be clouded by emotions, they need to calm down or look for the trades opposite to the extreme mood. For the judging traders, they may get out of trades too early due to market fluctuations. So they may trade a basket of positions so that the overall portfolio does not produce extreme losses.
I don't think there are any recommendations about how to tackle the shortcomings of introversion in the book. Personally, I think the establishment of simple but specific rules would help minimize the analysis paralysis. Actively participating group discussions should also make it more comfortable for taking advises.
Overall, this book of "Professional techniques to create generational wealth" provides an extensive range of topics on trading successfully as a professional trader. If a trader would like to deep dive into any one of the individual topics, he can find other books on each specific topic with similar length.
Here, I'd like to focus my study on one of the chapters regarding how to overcome weaknesses of a trader's personality. In order to identify a trader's strength and weakness, the book presents a series of questions in the following 4 aspects to categorize trader's personality, depending on the answers of the reader:
- How does the energy come from: Introversion or Extroversion
- How are decisions made: Intuition or sensation
- What kind of attention is used: Thinker or feeler
- What kind of lifestyle of a trader: Judging or perceiving
As an example, the trader with the following set of personality has specific strength and weakness as shown in the table below.
|
|
Strength
|
Weakness
|
|
Introvert
|
Informed decisions; thorough in analysis
|
Analysis paralysis; less comfortable trading with a
team
|
|
Intuitive
|
Good chart reader; look for relationships
|
Deviate from rules; overuse indicators to support
biases
|
|
Feeler
|
In tune with market; understand big picture; trade
with good accuracy
|
Stick to losing trades; emotional; too many bearish
trades
|
|
Judging
|
Decisive; self-starter; take action quickly; good
risk management skills
|
Susceptible to noises; not taking advises
|
The book gives some other insights beyond the typical baseline solution of imposing trading discipline: create specific trading rules and environments so that the weaknesses have minimal chances to show up in the trading process. This methodology, rather than trying to correct the weakness, should help to overcome the weaknesses since trader's personality is likely to remain over a long time in the trading career.
It's stated that the root cause of all weakness is the fear and greed. The only way to remove this element completely is not to care about profit and loss. Trade the amount that is totally comfortable for you if you face maximum loss. Personally, I think we can also avoid looking at the P&L all the time, by not showing the P&L in the trading software windows during trading battles.
For intuitive decision makers who like to look for evidence to support some trading biases, this type of traders needs to simplify the indicators to just one or two. For feelers whose trading action may be clouded by emotions, they need to calm down or look for the trades opposite to the extreme mood. For the judging traders, they may get out of trades too early due to market fluctuations. So they may trade a basket of positions so that the overall portfolio does not produce extreme losses.
I don't think there are any recommendations about how to tackle the shortcomings of introversion in the book. Personally, I think the establishment of simple but specific rules would help minimize the analysis paralysis. Actively participating group discussions should also make it more comfortable for taking advises.
Overall, this book of "Professional techniques to create generational wealth" provides an extensive range of topics on trading successfully as a professional trader. If a trader would like to deep dive into any one of the individual topics, he can find other books on each specific topic with similar length.
Saturday, February 28, 2015
Review of Jan and Feb Trades and max drawdowns
In January, I started trading my option selling strategy "Selling verticals at the edges". I paper tested this strategy and traded it with real money with 1 to 2 positions last year. They were posted in the blog. This year, I decided to increase the position to 3 which means my monthly open margin is close to 25% of my capital.
I posted the individual trades, as well as the trading plan, in our study group in the last couple of months. Now, I'd like to review and share the overall trades that were closed in Jan/Feb. January was a seriously challenged month for my trades, as all 3 opening positions were tested as shown in the chart below.

The prices of TLT and GLD moved in sync upward, pressuring my bear call spreads. The short strike $134 of the Feb$134/139c had a Delta of 0.67 when TLT rose to $137 area. So I had to adjust the position by rolling out and up on Jan 29. The next day, TLT continued to rise with a big gap up. It did give me a bit of psychological stress. I was evaluating the possibility to buy call options as insurance.
However, TLT started to turn down on the following day and had never gained strength to test the peak level so far. Interesting enough, the same behavior happened for my last October TLT adjustment (See surviving a 3 SD test on TLT). On the 1st day of adjustment, TLT shot up and my portfolio was showing the largest drawdown of the cycle. On the 2nd day of the adjustment, TLT started to pulls down.
With my TOS script, I was able to see the daily P&L for the portfolio and the largest drawdown based on closing prices. If I had not made the adjustment, the largest daily drawdown would be about $2.8K (2800/9000=31% of initially used margin). With the adjustment for which more capital was put in use, the largest daily drawdown increased to $3.5K (39%) roughly. This is a major characteristic of the strategy, because more capital risks are added due to adjustments. But the probability of profits also gets increased after the adjustment.
I posted the individual trades, as well as the trading plan, in our study group in the last couple of months. Now, I'd like to review and share the overall trades that were closed in Jan/Feb. January was a seriously challenged month for my trades, as all 3 opening positions were tested as shown in the chart below.
The prices of TLT and GLD moved in sync upward, pressuring my bear call spreads. The short strike $134 of the Feb$134/139c had a Delta of 0.67 when TLT rose to $137 area. So I had to adjust the position by rolling out and up on Jan 29. The next day, TLT continued to rise with a big gap up. It did give me a bit of psychological stress. I was evaluating the possibility to buy call options as insurance.
However, TLT started to turn down on the following day and had never gained strength to test the peak level so far. Interesting enough, the same behavior happened for my last October TLT adjustment (See surviving a 3 SD test on TLT). On the 1st day of adjustment, TLT shot up and my portfolio was showing the largest drawdown of the cycle. On the 2nd day of the adjustment, TLT started to pulls down.
With my TOS script, I was able to see the daily P&L for the portfolio and the largest drawdown based on closing prices. If I had not made the adjustment, the largest daily drawdown would be about $2.8K (2800/9000=31% of initially used margin). With the adjustment for which more capital was put in use, the largest daily drawdown increased to $3.5K (39%) roughly. This is a major characteristic of the strategy, because more capital risks are added due to adjustments. But the probability of profits also gets increased after the adjustment.
Subscribe to:
Posts (Atom)