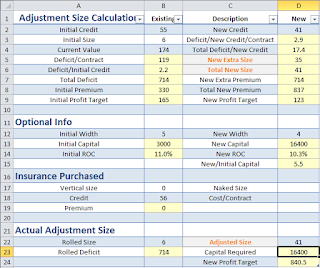
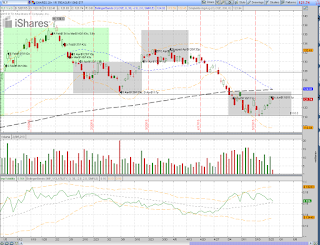
I used a spreadsheet to calculate my entry, stop and target points, as well as the reward to risk ration as shown below. In the end, this pattern failed and I sold the put at $1.2 after SPY gapped up on July 13. The insurance loss was $174 x 2 = $348. Thus the July SPY position had a minor loss $12 (=348 - 6 x 56) after SPY puts expired worthless yesterday.
Short Stock
|
Price
|
ATR
|
2.19
|
Swing low/Breakout
|
205.28
|
Resistance
|
208.02
|
Trade Trigger
- Below prior day low by 10% ATR |
205.061
|
Entry limit order
- Buy stop limit at 10% ATR below trigger |
204.842
|
Initial Stop
- Sell stop market is higher value of (1) 0.1 ATR above resistance, (2) Trigger price + ATR |
208.239
|
Price to set break-even stop
- equal Entry limit - (Initial Stop -Buy stop limit) - Drop new BE stop after a new swing high of 5 days+ is made |
201.445
|
Target
- Lower horizontal support - Range % within down trend line in last 5 weeks - Sell half & Trailing another half at 0.1 ATR above prior swing high or break-even - Sell last half at new target based on new pattern or larger time pattern (whichever is closer) |
198.5263
|
Reward/Risk ratio
- Must be greater than 2 |
1.8592028
|
Short Stock
|
Price
|
ATR
|
0.58
|
Swing low/Breakout
|
17.03
|
Resistance
|
17.91
|
Trade Trigger
- Below prior day low by 10% ATR |
16.972
|
Entry limit order
- Buy stop limit at 10% ATR below trigger |
16.914
|
Initial Stop
- Sell stop market is higher value of (1) 0.1 ATR above resistance, (2) Trigger price + ATR |
17.968
|
Price to set break-even stop
- equal Entry limit - (Initial Stop -Buy stop limit) - Drop new BE stop after a new swing high of 5 days+ is made |
15.86
|
Target
- Lower horizontal support - Range % within down trend line in last 5 weeks - Sell half & Trailing another half at 0.1 ATR above prior swing high or break-even - Sell last half at new target based on new pattern or larger time pattern (whichever is closer) |
14.08381
|
Reward/Risk ratio
- Must be greater than 2 |
2.6851898
|


