Pages

Sunday, October 28, 2012

October Trading Review

It's a busy weekend so I have to limit my writing here this time. I may update this review later when I have more time. Based on my template for the review, here're my topics.

Trading Rules

  • Adherence consistency
  • Skillful application/execution
Due to a smooth cycle in October, there was no much tests on the skillful application part.
  • Monthly rule review/study
Need to spend enough time to review trading rules. Otherwise, some unused rules may become vague in memory.

Market has told me the weak spot in my trading rules in September: Need to reserve extra time for trade adjustments. Currently, my system holds options till last 1 or 2 weeks before expiration. This is a fast time decay period but also risky due to lack of additional time in case trade adjustment is needed. In the past year, statistics kicked in most of times to favor fat profits in the last period of the cycle. However, there was only one time of September in which market would take away all those profits earned in the last period and it's a normal behavior for market statistics. If I had one or two more weeks for the options in September, the profits would have been kept safely. So I'll update my trading rules to make sure there is enough time to allow trade adjustment working in the last period of my monthly option cycle.

Psychology
  • Action during uncertainty
  • Risk Comfort ability/Adverse damage impact
  • Trade anxiety
  • Winning Altitude Development
October loss had a certain degree of impact on my trading execution which is not good. I need to work on the trading rules to minimize this type of impact. I plan to review my risk tolerance and P&L targets so that I can always stay in the comfort zone. The adjustment rules should also reflect the comfort zone.

I'll set up my rules so that I can take whatever P&L the market offers to reduce risks, instead of a fixed % of profit target. Winning consistency is a state of mind that excellent traders think in a way similar to below. The market offers endless opportunities month after month for theta seekers. Why worry about a couple of months that may not have profit. The high probably trades are guaranteed by statistics. The losses should be expected, the money management and adjustment rules guarantee limited damages. Trade to another month since there are always endless months to continue for profits. Even an average of 3% per month is an excellent achievement for a trader.


Trading Time

  • Trading days
Trades were limited due to relative calm market. Spent some time writing about Greeks and Profit/Loss targets.
  • Rest days
Spent a lot of time developing this blog in weekends. Expect to reduce the time in the future to suit my life style.

Trades and Market Replay


  • Market Forecast
Market was forecast-ed to have downward pressure which was correct in general. Within a few days after closing the bullish SPY diagonal call spread in September, market started to top and went down in a few weeks.
  • Trades and Adjustments 

October high probability portfolio was a short and sweet cycle with just one adjustment to hedge the downside risk. Even though it turned out the market did not sell-off after the hedge immediately, the smooth portfolio still reached its target around 3 weeks after initial position.

Friday, October 26, 2012

Vertical Adjustment for the high probability portfolio

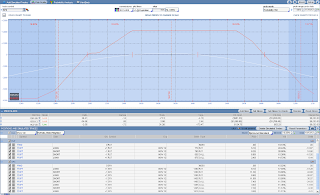
Market does not want to offer an exit for the November high probability trade portfolio this week and continued to drop. Even though the SPX and VIX are at the borders of their corresponding Bollinger bands, there is no sign a capitulation. I'm concerned that continued market sell-off would cause my delta even worse. So I played with calendar adjustment first and realized that an ATM vertical spread served the best for the smooth portfolio. So I sold a $15 wide RUT call spread to neutralized delta by 17. The adjusted portfolio P&L curve looks like the following.

As a record, the P&L curve before adjustment is shown below.
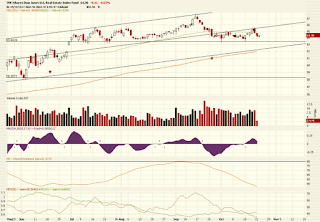
On the IYR front, I have rolled the Nov$65c down to Nov$63c a couple of times, one half yesterday for a credit of $0.84 and one half today for $0.75. The support appears to be at $62 area by 200DMA line.

Tuesday, October 23, 2012

Triple Calendar Adjustment for Delta Neutral Portfolio

Market had a sell-off early in the morning, then rebound a little bit. Since SPX broke my support line around 1420 with higher volume and the SPX P&L curve was attacked from the low end, I decided to hedge my portfolio with adjustments.

After playing with a few strategies trying to neutralize delta, I settled on a triple calendar that reduced delta by 4. It is not an easy job to make large delta adjustments while maintaining a smooth P&L curve and it's not necessary to cut delta to 0 in one shot. I placed 3 separate calendar orders with $0.10 above mid prices. They all got filled in a few minutes.

The following image was simulated to record the P&L graph before adjustment and showed movement of break even points.
Note on the paper traded account for 2 month expiration option portfolio, there was no need for adjustments, as the delta and the graph did not show any needs.

Monday, October 22, 2012

Rolled diagonal for IYR


A couple days after rolling up the IYR Nov$67c, market started tanking. The IYR followed the market to a point where the $67c was only $0.05. So, I rolled it down to Nove$65c of Delta=0.39 for a credit of $0.50, even though the outlook of IYR has not been damaged by the market yet.


Created with ProphetCharts®

Paper traded double calendar to complete High Probability Portfolio

In the last week, I had paper traded one iron condor for SPX and RUT each, after initiating the SPX iron condor. Today, I completed this test portfolio with a double calendar on RUT with 59 days to expiration. The 2-month out calendar cost about twice as a one month out calendar of similar probability. Also the D.C. got wider ($40) call/put strikes. Note there was not Jan option available for RUT calendar. So I had to choose a further out month. The 2M portfolio withstand the dramatic market moves in the last week pretty well. We'll see how it performs in the next 30 days.

Saturday, October 20, 2012

Template for Monthly Trading Review

The monthly trading review should be part of a trading business process. I'd like to create a review template for monthly trading review and analysis. The review should occur in the 1st or 2nd week of each monthly option expiration cycle. The template can be updated in the future when necessary.

Trading Rules
  • Adherence consistency
  • Skillful application
  • Monthly rule review/study

Psychology
  • Action during uncertainty
  • Risk Comfort ability/Adverse damage impact
  • Trade anxiety
  • Winning Altitude Development

Trading Time
  • Trading days
  • Rest days
Trades and Market Replay

  • Market Forecast
  • Trades and Adjustments


The trade performance analysis is left out in the monthly review intentionally to promote process-based trading and avoid outcome-based thinking. Follow a solid process, good outcome will be realized after a series of high probability trades. A quarterly trading review template should be created later to cover the trading process at a higher level and include the performance analysis and trading rule refinement.

Thursday, October 18, 2012

Roling up IYR diagonal


IYR seems to have bottomed in the last 3 weeks. It jumped today and the delta of Nov$64c reached 0.7. So I rolled up to Nov$67c of delta 0.15. The overal short delta for my IYR positions is about 0.35 now, in alignment with changed bullish posture for it.

If market confirms the bullish projection, I'll add more IYR bullish positions next week.


Created with ProphetCharts®

Wednesday, October 17, 2012

November Inventory Adjustment

Market had advanced on stronger volumes in the last couple of days, causing the option income portfolio minor damages as shown in the image below.

In particular, the SPX price moved to the right shoulder of profit graph. With 29 days to go, I still have time for iron condor. So I rolled up the spreads of both calls and puts of an original iron condor to points where there are about 25% to 20% of expiring ITM. The resulted P&L curve still looks smooth, even though the max potential profit is reduced. The new return rate is in my acceptable range. The rolling of IC does not neutralize delta too much, only 5 points or so.
Note the profit in the new portfolio should be the value indicated in the image minus about $360, to account for the debit of closed spread.

Monday, October 15, 2012

Completing NOV Inventory with $RUT Double Calendar

There was a smooth market at the moment. I bought the RUT double calendar to complete my November income portfolio, according to my plan. As usual, I placed a limit order with $0.05 above mid price and it was filled immediately. After the fill, I found the mid price dropped $0.10 or so for a couple of minutes caused by market activities then backed up. The DC reduced the portfolio vega by 90, almost the amount of that of 2 iron condors. The probability of success at expiration at either break even points is in high 70%.

Sunday, October 14, 2012

Using P&L Curve and Greeks together to Manage Time-selling Portfolio

I have spent some time stream-lining my thoughts on managing the monthly income, time-selling and delta neutral portfolio with the Greeks and the Profit and Loss Graph. This is the last post on this topic for now.

The P & L Graph is a very good tool to present the current and expiration P & L across different prices. Its expiration (red) curve demonstrates the potential P & L during expiration. This is not easy to figure out from the Greeks if the expiration has many days to come.

The Greeks are good at estimating the immediate term (1 day or 2) P & L only, since they change significantly with prices and volatility. The Greeks are closely related to the current P & L (white) curve. For high priced stocks (i.e. SPX, RUT), it is not easy to estimate their P & L directly using the Greeks, because the stocks may change $10 a day but the Greeks (delta) measure the change of $1 only. A series of calculations would have to be made to get an approximate estimate of the portfolio P & L changes when using Greeks.

Combining the expiration P & L curve with Greeks should make it easier to manage the portfolio. At the option inventory building phase, I make every attempt to build a monthly portfolio with smooth expiration profit curve. As market attacks the portfolio with disruptive price changes, I will watch the market price against the expiration P & L. If the price is near the break even points, I would make adjustments. When making adjustment, I will manage the Greeks to neutralize market disruptions and try to maintain a smooth expiration curve again. If the expiration graph is not available, the Greeks should alarm for potential risks. An increasing absolute value of delta signals the white curve moving away from the center of the expiation (red) curve.

Friday, October 12, 2012

More Iron Condors for November Option Portfolio

In the last few days, I continued to build my monthly option income portfolio. Market are relatively calm with downward pressure. The portfolio looks good with one more position to be added next Monday.
With one week left for Oct, I rolled IYR Oct$64c to Nov$64c for $0.61, still slight bearish on it.

SPX Iron Condor 2 Month Out

The benefit of a 2 month-out iron condor is less volatile or more smooth during the first 30 day period. If price goes wrong in this initial period, adjustments are relatively easier to make. So if the trade can reach an acceptable profit target in the first 30 days, it will suit well for a conservative portfolio. Let me paper trade this concept for 3 months to investigate if this type of trades are good for my style.

The time frame will be initiating positions 70 to 60 days ahead of expiration and closing positions 40 to 30 days before expiration. If adjustments are made near the end of the trading period, I will give it some more time (7 to 14 days extra) for the adjustments to work out (reaching projected profit target around 8% to 10%).

Note comparing this trade with a single month out IC constructed with the same principal, it has about one half of Theta and Gamma. The delta and vega have similar values.


Monday, October 8, 2012

Initiating November Option Inventory for High Probability Portfolio

With 38 days to go for November and a clean exit on October last week, I started building the November smooth portfolio. The plan is to diversify strikes and gradually complete the portfolio in the next few days. Today I completed the first sell of NOV SPX iron condor. It was a calm day and I got the fill price even better than mid price which was my limit order. What a surprise gift for Columbus day.


Rolling down IYR diagonal call spread


As IYR Oct$66c has its delta reduced to 0.1, I continued to roll down the diagonal to Nov$66c of delta 0.41, which is a little higher than what I usually do. It reflects my slightly bearish posture for the next couple of weeks. The credit was $0.70.


Created with ProphetCharts®

Sunday, October 7, 2012

What are proper Greeks for delta neutral portfolios?

Unlike those portfolios seeking alpha (price performance), the smooth portfolio seeks theta. Even though the concept of option portfolio management by Greeks is known, but what are the suitable Greeks values for different portfolios?

It should be easier to derive the Greeks according to the amount of portfolio profits and risks, and a fixed set of trading instruments. Converting percentage numbers on my last profit and loss projection post, the smooth monthly income option portfolio may profit in the ranges of $600 each month when trading two contracts for SPX & RUT. If the portfolio faces risks of over 60% of the profit target ($360 to $400), then it may be time for adjustments. So if my high probability option portfolio has Greeks exceeding the following values, I should consider adjustments, considering SPX moves $10 frequently.
  • Delta      > 36 to 40
  • Gamma  > 2  (If G=2, delta would change 20 when SPX moves 10)
  • Theta     < 20 ($600 over 30 days)
  • Vega     > 400 or < -400 (Assume VIX changes 0.5 on average, causing $200 changes)
I will update these values in the future to reflect my real and fine-tuned Greek adjustments in trading.

If the high probability option trade portfolio uses different stocks each month, the Greeks for such portfolios would vary since the P & L are impacted by the stock prices, as explained in my previous post on this subject. For such portfolios, the usage of an indicator such as ATR should be helpful to determine the short term potential P & L if prices moves in ATR range.

Saturday, October 6, 2012

A Study of Market Moves, VIX and FED meetings

At the FED's Sept Meeting day, market was overbought. But after the announcement, market shot up again. Could we anticipate 1 to 2 day market moves after the FED meeting announcement or minutes with an acceptable accuracy? I studied the SPX and VIX price movements at various (6) times of the FED meetings this year. The green lines represent statement announcement days and yellow lines represents meeting minute days.

Of the 6 times of statement announcements this year, at least 5 times came with large SPX moves within 1 or 2 days and VIX had large trading ranges every time.

If the SPX is in top of bollinger band but VIX is not in the bottom of its Bollinger band, the SPX could continue to spike higher to continue its trend (somewhat represented by the MACD as well).

There was no time that VIX was high enough to be at the top of BB around FED statement dates! It's probably because of the general uptrend this year.

Overall, it's not a clear picture to make solid judgement for forecasting FED impacts, with these set of indicators. FED meeting were market friendly without major disruptions. FED minutes created less volatility than the initial announcements.
Update: VIX always dropped within 1 or 2 days after the FED announcement which the price did not increase every time in the same time frame.

Thursday, October 4, 2012

Exit of October Option Portfolio On Profit Target

Yesterday, the monthly income portfolio reached the initial profit target with 15 days left. The portfolio was closed to eliminate risks. November portfolio will get started next week.
With the far OTM options in SPX, it took about 20 minutes to have one OTM spread to get filled even if the prices was set $0.20 above mid price. For RUT, one OTM option was too far to have a quote. I set closing price to mid price. Even if the spread could not be closed, there is extreme small chance to endanger it. In the end, the spread was filled as well, after may be one hour as RUT price moved.

It looks like if the option price is too far out-of-the-money (<$1.0 or $2.00) for SPX or RUT, the bid/ask   of the option price are likely to cause fill issues. Of course, for option sellers the spreads can expire worthless to get full profit potential, with extremely low probability of risks.